Quantcast
Channel: CYCLINGABOUT.com
Viewing all 446 articles
Browse latest View live

Rim Dynamos Can Now Generate 70% MORE Power Than Hub Dynamos

$
0
0

If you’re old enough, or simply have a penchant for vintage bikes, you’ll know exactly how terrible rim dynamos of the past have been. That little wheel grinding away on the side of your tyre, making it feel like you’re riding in the sand, generating a tonne of noise, with a halogen globe threatening to blow at any moment… and just for a pathetic dim orange glow.

We can all acknowledge that this was a low point in bicycle power production, but hey, it’s 2020 and technology has progressed. As of this month, if you want to harvest power from your bike, the most powerful and most efficient way is using a modern rim dynamo.

In this resource, we will be examining the pros and cons of rim dynamos and we’ll be looking at the latest performance stats too.

How Do Rim Dynamos Compare to Hub Dynamos?

ADVANTAGES
– You can disengage the rim dynamo completely (dynamo hubs have 1-5 watts friction while spinning with nothing connected)
– You don’t need to rebuild a wheel if there is a dynamo failure.
– It’s an easy install and you can take it off your bike when you don’t need it (or transfer it to another bike).
– The best rim dynamo can harvest 40-70%(!) more power than a hub dynamo.
– The best rim dynamo is 10-20% more efficient than the best dynamo charging setup.
– The lightest rim dynamo is 200+ grams less weight than a hub dynamo setup.

DISADVANTAGES
– Rim slippage above 25KPH (this is only relevant if your plugged-in device is drawing lots of power).
– Rim dynamos make more noise than a dynamo hub.
– Regular replacement of the o-rings is required (~3000km or 2000mi is the approximate wear life).
– They probably won’t work well with rim contaminants (eg. thick mud).
– The most powerful, most efficient option is not particularly elegant.
– Only a handful of dynamo lights and two USB chargers are compatible.
– There could be a lot of drag at high speeds… if your plugged-in device is consuming high amounts of power (I’ll clarify below).

Rim Dynamo Products In This Comparison

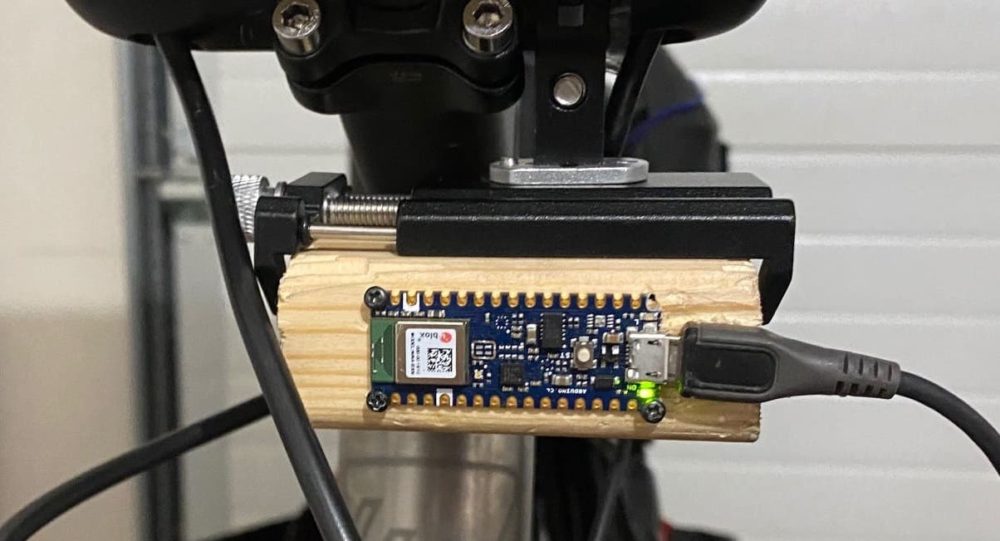
PedalCell CadenceX Rim Dynamo and Charger Kit // US $299 and 450 grams
This three-phase rim dynamo is a charging-only kit with everything you need to start a bicycle power station! The “Smart Power Hub” simply attaches to your stem, and it has two USB-C charging ports – a “safety” port with 3-watts maximum power and a “high-power” port with more than 10-watts of available power. Inside is a series of supercapacitors that deliver a stable power output and can keep the power running to your device for about 30 seconds if you stop.

You can see the CadenceX rim dynamo kit on the PedalCell website.

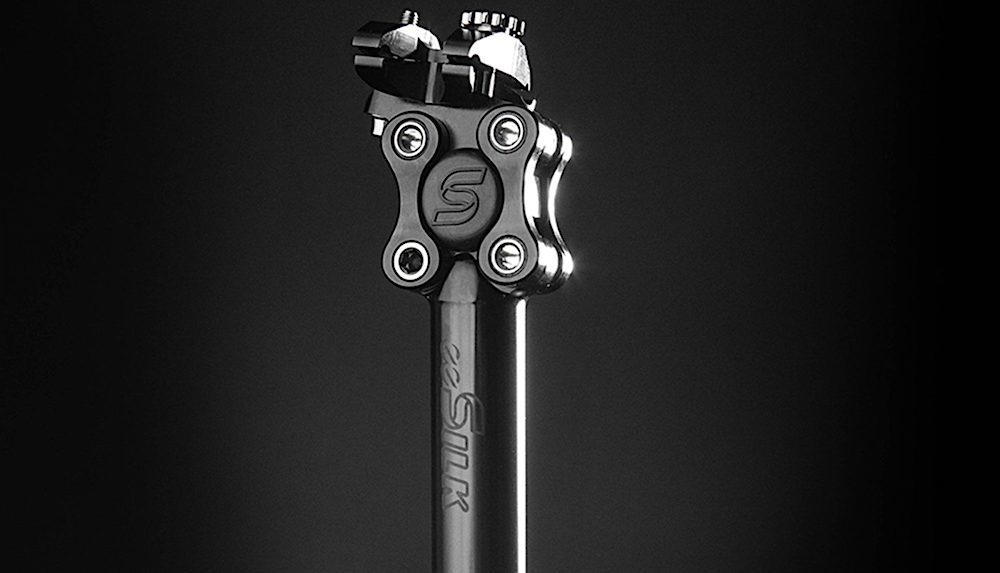
Velogical Special 3-Phase Rim Dynamo and Charger // €330-380 and 240 grams (approximately)
This new three-phase rim dynamo from Velogical is designed specifically for low-speed riding and charging. It’s a much more versatile dynamo than the CadenceX, as it can be run with dynamo lights (DC power). There are two different charging options too – an in-house charger and an aftermarket charger (Forumslader), both incorporating buffer batteries for constant power flow to your device (if you stop at some traffic lights, for example). On top of its versatility, it looks good, and it’s incredibly small and lightweight – you can expect a charging kit to be close to half the weight of the CadenceX.

You can see the Velogical rim dynamo and charger on the Velogical website.

The Test

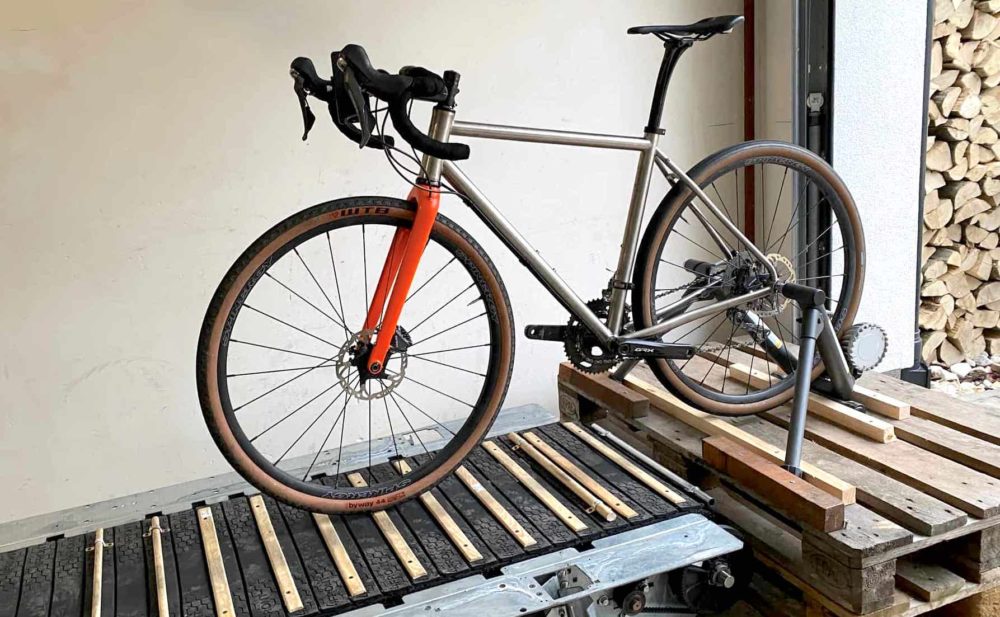
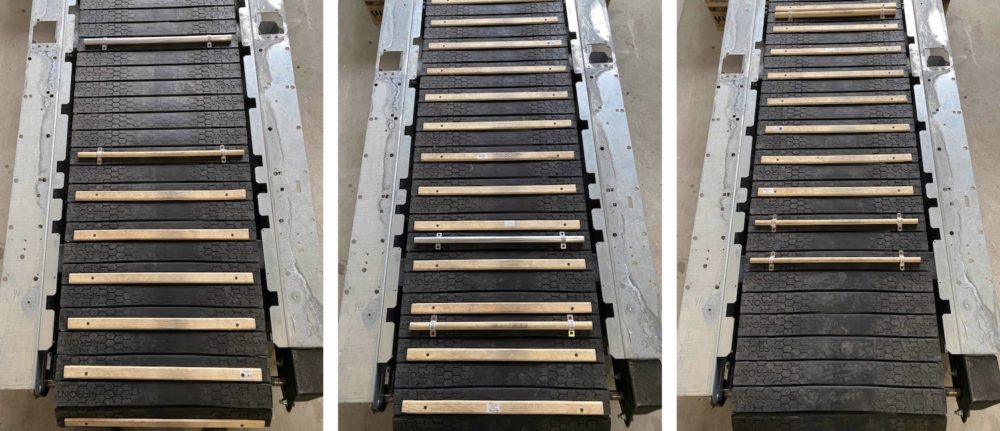
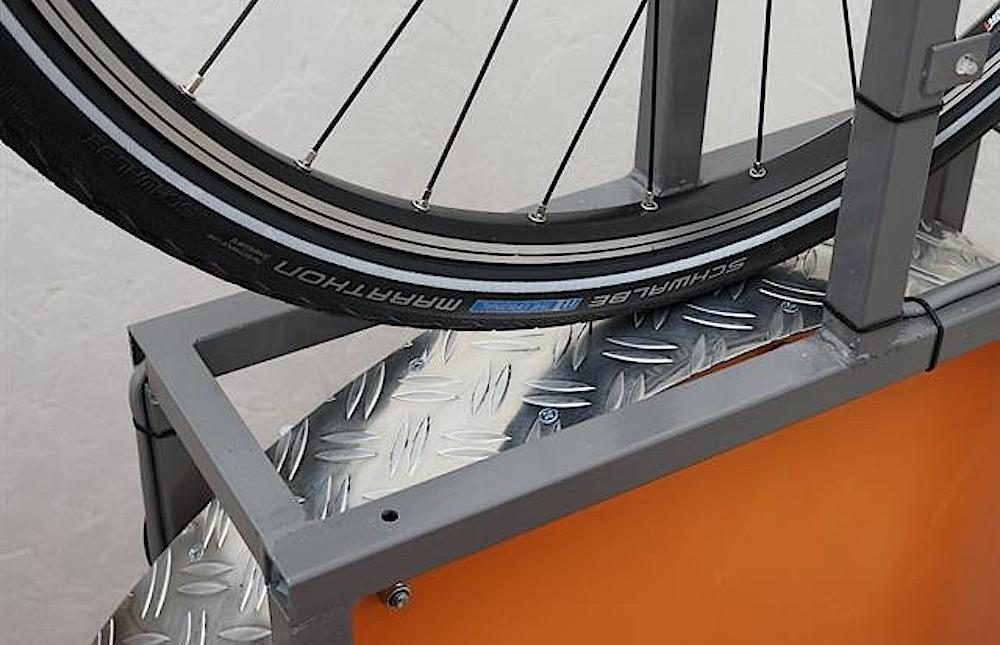
The FahrradZukunft rim dynamo test rig. Image: FahrradZukunft

Olaf Schultz and Andreas Oehler over at FahrradZukunft have done all the heavy lifting to make this data possible. Their rear frame triangle test stand is able to measure torque and speed, and take all the necessary electrical measurements (volts, current, power etc).

If you’d like to know more, the test rig is described in detail in the article, “Current rim rotor dynamos in the laboratory test”.

How Much Power Can A Rim Dynamo Generate?

The PedalCell CadenceX is the dark blue line and the Velogical chargers are the pink and military green. Image: FahrradZukunft

The PedalCell CadenceX offers significantly more power than any other USB charging system, it’s 42-70% more power than the best hub dynamo charging setup. The CadenceX is especially impressive at low speeds where it’s already delivering 2.5-watts* before 9KPH.

The Velogical rim dynamo with the Forumslader USB charger is a bit slow to get started, but once it hits 15KPH, it has found its stride and is generating more power than the best hub dynamo charging system – although the additional power is a more modest 10% gain.

You can see the full FahrradZukunft results HERE.

The Best Hub Dynamo Charging System:
1.7-watts @ 10KPH
3.4-watts @ 15KPH
4.8-watts @ 20KPH
7.0-watts @ 25KPH

PedalCell CadenceX Rim Dynamo:
2.9-watts @ 10KPH – 70% more power
5.2-watts @ 15KPH – 53% more power
7.3-watts @ 20KPH – 52% more power
10-watts @ 25KPH – 42% more power

*I use 2.5-watts as a benchmark because many smartphones require a consistent 2.5-watts or they don’t accept the charge.

The Power Is Great, But Are Rim Dynamos Efficient Too?

Dynamo efficiency refers to the amount of power available relative to the amount of drag slowing you down. There is simply no free ride when it comes to harvesting pedal power – you always have to work a bit for it – but a higher efficiency means that more of your pedal power can go directly to charging.

The CadenceX has been tested to be more efficient (68%) than the best dynamo hub and the Velogical works out to be only a touch more efficient (35%) than a lower-performing hub. The highest-performing dynamo hub can average 50-60%* efficiency when charging while the lowest-performing hubs averages between 30-35%*. You can read my full hub dynamo efficiency analysis HERE.

*These dynamo efficiency numbers are from a different test rig under a different testing protocol. In addition, less power was getting drawn on the hub dynamos, so please just use these numbers as a guide.

I’ve calculated the following numbers based on the dynamo drag at the wheel vs. how much output power is offered at the USB port:

CadenceX Rim Dynamo USB Charger
71% @ 10KPH
71% @ 15KPH
66% @ 20KPH
68% @ 25KPH
68% average efficiency between 15-25KPH

Velogical Rim Dynamo with Forumslader USB Charger
7% @ 10KPH
29% @ 15KPH
37% @ 20KPH
41% @ 25KPH
36% average efficiency between 15-25KPH

Velogical Rim Dynamo with Velogical USB Charger
21% @ 10KPH
31% @ 15KPH
35% @ 20KPH
39% @ 25KPH
35% average efficiency between 15-25KPH

How Quickly Can The CadenceX Fill A 5000mAh Battery Pack?

If you were touring at 15KPH, the CadenceX would be putting out 5V and 1.04A, which for an hour of riding is 1040mAh. A 5000mAh battery pack would then take 4 hours and 48 minutes to charge from empty.

However, there are also small losses in the charging circuitry, typically 10-30% of the total generated power. If we add 20% to the ride time (5 hours + (5 hours x 0.2)), we’re looking at 5 hours and 45 minutes of riding to fill the battery from scratch.

At 20KPH, the CadenceX will be putting out 5V and 1.46A, which for an hour of riding is 1460mAh. The same 5000mAh battery pack would take 4 hours and 6 minutes to charge, including the battery storage losses, at this higher speed.

Do Rim Dynamos Offer Too Much Power?!

A graph showing the drag associated with the different rim dynamos. Image: FahrradZukunft

While the efficiency is excellent, especially on the CadenceX, there is a high drag associated with these rim dynamos simply because of the high amounts of power they can generate.

But importantly, a rim dynamo will only have a high drag if your plugged-in device is drawing a high amount of power too.

I’d recommend charging smaller devices if travelling at high speeds, ideally things that require less than 5-watts of power. The CadenceX actually has a “safety” USB-C port which will only allow a maximum of 3-watts – that would be perfect for high-speed use.

Velogical Special vs. PedalCell CadenceX

The CadenceX has only just been launched (October 2020), so I have no idea whether it’s durable, waterproof or reliable. I have recently spoken to the team behind the product who have informed me that the production unit is more powerful again, fully water sealed and is more compact than the prototype unit tested by FahrradZukunft. The production version is now expected to exceed 70% efficiency, which is incredible.

There is a very strong case for the CadenceX if, like me, you travel at speeds averaging between 8 and 20KPH. The drag is low and the power output is high at these speeds – there is simply no hub dynamo setup that gets close at low speeds.

Keep in mind, there is no buffer battery in the CadenceX system, so you’ll want to add one if you’re riding up hills (below 8KPH) or wanting to charge things on routes with lots of stop-start (eg. traffic lights that are longer than 30 seconds).

Unlike the CadenceX, the Velogical Special is super compact, elegant, lightweight and can be used in conjunction with dynamo lights (DC variety). Both the Velogical and Forumslader USB chargers include buffer batteries for start-stop and the Forumslader USB charger can be integrated very neatly into your steerer tube too. As the Velogical dynamos have been sold for many years, there should be no issues with reliability.

While the CadenceX offers 2.5-watts at 9KPH, you’ll need to maintain 14KPH to achieve the same power with the Velogical kit, so make sure you’re averaging >15KPH to make the most of charging with the Velogical.

Rim Dynamo Summary

Initially, I was very surprised by these results.

But the more I thought about it, the more it makes sense that a rim dynamo can provide so much power at such high efficiency. Everything in the CadenceX charging system, in particular, has been optimised to work together – from the rim dynamo through to the charging circuitry.

In comparison, hub dynamos and chargers are always compromised as they need to be compatible with hundreds of lights and dozens of USB chargers. In addition, hub dynamo equipment is always designed around German legal regulations (StVZO) in terms of power output, which likely throttles what is technologically possible.

In the last decade, we have gone leaps and bounds in terms of dynamo charging setups, so I’m really looking forward to seeing how both of these rim dynamos develop in the coming years. If the current test results are anything to go by, the future is looking very bright for this charging technology.

Learn About Dynamo USB Chargers HERE, Dynamo Hubs HERE, Dynamo Wiring Systems HERE, Pass-Through Batteries HERE and Dynamo Lights HERE

The post Rim Dynamos Can Now Generate 70% MORE Power Than Hub Dynamos appeared first on CyclingAbout.com.


List of Hub Dynamo USB Chargers and Charging Systems for Electronic Devices

$
0
0

Currently, there are 27 different hub dynamo USB chargers available.

Dynamo chargers are particularly useful if you carry any battery-powered gadgets. I use my Cinq Plug5 Plus to top up my iPhone, eReader, head torch, GoPro and 5000mAh power bank. Previously, I’ve charged GPS devices, batteries (AA, AAA), USB powered lights, cameras, speakers, MP3 players and much more.

If you’re bikepacking off-road or spending lots of time on steep mountain roads, you may want to skip on these dynamo chargers and instead use a power bank or solar charger. Dynamo chargers are essentially useless at charging power-hungry devices (eg. smartphones) when you cannot average 12KPH/7MPH for the majority of your ride.

That said, hub dynamos can charge power-efficient devices at as little as 5KPH/3MPH – this includes Spot trackers, GPS devices or small battery packs, and is the reason why hub dynamos are still popular for ultra racing.

If you’re travelling on terrain that has you cycling above and below 12KPH, make sure to add a buffer battery into your charging system, which will supply power to your device when the dynamo can not (eg. when cycling at low speeds or when stopping at traffic lights).

The above is a very brief introduction – if you want to learn it all, it could be worth digging into my full series:
Dynamo Hubs
Dynamo Lights
Dynamo USB Chargers
Dynamo Wiring
Buffer Batteries
Rim Dynamos

This article was originally published in March 2012 but has been updated in November 2020.

Key Stats For Benchmarking Dynamo USB Chargers

dynamo usb charger

To help you compare the hub dynamo USB chargers in this resource, I have listed their key specs and have organised them according to type (“integrated”, “in-line” and “light” chargers). Within these categories, you’ll also find them ranked in terms of available output power when cycling at 20KPH.

Speed at 2.5W – This is the speed you need to ride in order to achieve the minimum charge for many smartphones.
Power at 20KPH –
 This is the maximum output power at the USB port at 20KPH.
Power Output Graph – If the charger has been tested, I have included its power output graph.
Buffer Battery –
 If a buffer battery is integrated into the system, I have listed the battery’s capacity here.
Price – Retail price on the dynamo USB chargers.

Integrated: Forumslader V5 Ahead

page street cycles

Forumslader V5 Ahead dynamo USB charger.

The Forumslader V5 is the most powerful dynamo USB charger on this list above 20KPH. It is able to hit 2.5-watts at 13KPH and almost 5-watts at 20KPH. A cool thing about the Forumslader products is that they’re constantly getting updated with the latest tech and circuitry due to their small-scale production.

Speed at 2.5W: 13KPH
Power at 20KPH:
 4.8-watts
Power Output Graph: HERE
Buffer Battery: 2100mAh
Price: €227

Integrated: Cinq Plug5 Plus

dynamo usb charger

Cinq Plug5 Plus dynamo USB charger.

The Cinq Plug5 Plus is the most powerful USB charger below 20KPH and it’s almost certainly the neatest. When you don’t have anything plugged into the unit you can hide the USB-C plug by rotating the ratcheting top cap door. There’s a 1100mAh battery hidden in the steerer tube which steps in when your speed drops below 12KPH, and simultaneous operation of lighting and charging is possible (although, I’ve found it only really maintains my smartphone battery level, rather than fill it). The Plug5 is made exclusively for the new USB-C plugs so you may need to buy an adapter or different charging cable if you select this option. If you’re after a rare USB-C-to-iPhone cable in a short length, check out this one on Amazon.

Speed at 2.5W: 12KPH
Power at 20KPH:
4.6-watts
Power Output Graph: HERE
Buffer Battery: 1100mAh
Price: €259

Integrated: Cycle2Charge V3

dynamo usb

Cycle2Charge V3 dynamo USB charger.

This headset top cap option from Cycle2Charge is available at an exceptional price point. It produces the minimum charge for a smartphone at 16KPH (2.5W), but it’s between 20 to 25KPH where it makes the bulk of its power. The nice thing is that this charger uses a rotating dome to protect the USB plug when not in use.

Speed at 2.5W: 16KPH
Power at 20KPH: 
4-watts
Power Output Graph:
HERE
Buffer Battery:
No
Price: €69

Integrated: NC-17 Appcon 3000 (Dynamo Harvester)

dynamo usb

NC-17 Appcon 3000 dynamo USB charger. Image: GPSRadler.de

The NC-17 Appcon 3000 (previously Dynamo Harvester) is one of the more powerful chargers available. The unit fits inside the steerer tube, but rather than offering a charging port at the stem, the USB port is routed into your handlebar bag. This charger is particularly popular for riders with carbon steerer tubes (usually solid on one end), as the cables enter and exit at the top of the steerer tube.

Speed at 2.5W: 13KPH
Power at 20KPH:
 3.5-watts
Power Output Graph: HERE
Buffer Battery:
 3000mAh
Price: €229

Integrated: Sinewave Reactor

sinewave reactor

Sinewave Reactor dynamo USB charger.

The Sinewave Reactor offers the same functionality as their other chargers, but it has been incorporated into a 43 gram, super slim headset top cap. The electronics are neatly integrated into the fork steerer, making it somewhat theft-proof and elegant. It’s manufactured in the USA and tends to get rave reviews from many users.

Speed at 2.5W: 17.5KPH
Power at 20KPH:
 3-watts
Power Output Graph: HERE
Buffer Battery:
No
Price: US $220

Integrated: Cinq Plug5 Pure

The Cinq Plug5 Pure is a lower-cost version of the Plug5 Plus, that is sold without the steerer buffer battery. In addition, the charger is not as powerful – the maximum output current is 700mA (while the Plug5 Plus offers 1.2A). There is currently no data available but it will likely offer ~35% less power than the Plug5 Plus at 20KPH.

Speed at 2.5W: No data
Power at 20KPH:
No data, but likely around 3-watts
Power Output Graph: No data
Buffer Battery: No, but it is designed to be used seamlessly with the Smart Power Pack
Price: €159

In-Line: Dynalader Digital 2 USB Charger

Speed at 2.5W: 13KPH (non-independent testing)
Power at 20KPH:
6-watts (non-independent testing)
Power Output Graph: HERE
Buffer Battery:
 4800mAh
Price: €145

In-Line: Forumslader V5

Forumslader V5 Dynamo USB Charger

Forumslader V5 dynamo USB charger.

The Forumslader V5 is also available in a larger unit that will sit inside a handlebar bag for a MUCH lower price!

Speed at 2.5W: 13KPH
Power at 20KPH:
 5.1-watts
Power Output Graph: HERE
Buffer Battery: 2100mAh
Price: €110

In-Line: NC-17 Connect Appcon GT (Dynamo Harvester)

hub dynamo usb charger

NC-17 Connect Appcon GT dynamo USB charger.

NC-17 also make a more powerful charger that sits in a small bag on the handlebar (or inside a handlebar bag). This charger (previously Dynamo Harvester Plus) is half the price of the NC-17 Appcon 3000 but offers some of the highest USB outputs above 20KPH.

Speed at 2.5W: 16KPH
Power at 20KPH:
4.5-watts
Power Output Graph:
HERE
Buffer Battery:
 3000mAh
Price: €110

In-Line: Igaro D2

The Igaro D2 chargers are compact, waterproof and hand-assembled in the UK. They are available in three different versions with varying levels of performance – in short, more money allows you to harvest more power. The D2 chargers come with a lifetime warranty, in fact, Igaro will ship warranty replacements anywhere in the world for free.

Speed at 2.5W: 13KPH (D2 Pro), 15KPH* (D2 Standard), 17KPH* (D2 Lite)
Power at 20KPH:
 4.4-watts (D2 Pro), 4.2-watts* (D2 Standard), 3-watts* (D2 Lite)
Power Output Graph: HERE and HERE* (check the Igaro website for the latest data)
Buffer Battery:
No
Price: US $185 (D2 Pro), US $140 (D2 Standard), US $95 (D2 Lite)

*Non-independent testing

In-Line: Lumi-Con P5 Bike Harvester

dynamo usb

Lumi-Con P5 dynamo USB charger.

The Lumi-Con P5 offers excellent specs for the price. It has the 2nd highest power output at 15KPH of any charger, and above 20KPH it’s the 4th most powerful. Additionally, it’s fitted with 3500mAh worth of batteries which will have saved some power for when you’ve finished your ride.

Speed at 2.5W: 14KPH
Power at 20KPH:
4-watts
Power Output Graph:
HERE
Buffer Battery:
 2500 or 3500mAh
Price: €99

In-Line: kLite USB Charger

Kerry at kLite makes some amazing light and dynamo systems for remote backcountry use. His focus is specifically on reliability, so his systems are as simple as possible, using thick internal cabling, full waterproofing and smoothing capacitors that offer ultra-consistent waveforms (best practice for direct charging; Kerry says they take up half the charging unit). The kLite charger also offers solar charger input and 2x USB output ports (1x Spot Tracker or GPS + a smartphone or other power-hungry device).

Speed at 2.5W: 16KPH (non-independent testing)
Power at 20KPH:
3.2-watts (non-independent testing)
Power Output Graph:
HERE
Buffer Battery:
 Available separately
Price: US $140

In-Line: Sinewave Revolution

Sinewave Revolution

Sinewave Revolution dynamo USB charger.

This small 38-gram waterproof charger can be connected directly to phones or power packs and is especially popular given it offers the same performance as the Reactor but with a lower price tag. It will achieve 2.5W at 17KPH, 3W at 20KPHH and 4.5W at 30KPH. Like all Sinewave products, it’s made in the USA.

Speed at 2.5W: 17KPH
Power at 20KPH:
 3-watts
Power Output Graph: HERE
Buffer Battery:
 No
Price: US $120

In-Line: Busch and Muller E-Werk

Image: GPSRadler.de

B&M E-Werk dynamo USB charger. Image: GPSRadler.de

The E-Werk is a unique unit as you can control the voltage (2.8 to 13.3 V) and current (0.1 to 1,5 A) to suit the charging specifications for each device you’d like to charge. While it’s a great idea in theory, it really just makes the charger more complicated than necessary. The only time I can see this feature being useful is if you’re regularly travelling ultra-fast (40KPH+) or slow (<7KPH). In terms of performance, the E-Werk will hit smartphone levels of charging at 17.5KPH and by 30KPH it will be producing over 4-watts.

Speed at 2.5W: 17.5KPH
Power at 20KPH:
 3-watts
Power Output Graph: HERE
Buffer Battery: Available separately for $105
Price: US $210

In-Line: Busch and Muller USB-Werk

Busch Muller USB Werk Dynamo Charger

B&M USB-Werk dynamo USB charger.

The USB Werk is the more recent release from Busch and Muller (it’s getting old now). It’s a stripped-back version of the E-Werk but with tiny cache battery built-in. It can achieve smartphone levels of charging (2.5-watts) somewhere between 14 and 19KPH (two different tests).

Speed at 2.5W: 14 to 19KPH
Power at 20KPH:
 2.6 to 3.3-watts
Power Output Graph: HERE and HERE
Buffer Battery: 300mAh
Price: US $150

In-Line: USB2BYK

USB2BYK USB Charger

USB2BYK dynamo USB charger.

Speed at 2.5W: 20KPH (non-independent testing)
Power at 20KPH:
 2.5-watts (non-independent testing)
Buffer Battery:
No
Price: €39

In-Line: Kemo M172N

Kemo 172N USB Dynamo Charger

Kemo M172N dynamo USB charger.

The Kemo M172N is a dynamo USB charger with a built-in switch so that you can choose between sending power to your lights or your USB device. It’s an absolute bargain, and from all accounts, works really well if your average speed is above 20KPH.

Speed at 2.5W: 22KPH
Power at 20KPH:
2.3-watts
Power Output Graph: HERE
Buffer Battery:
No
Price: €30

In-Line: PowerBUG

Another cheap charger from Poland is the PowerBUG. While you need quite high speeds to access smartphone levels of power, it definitely won’t break the bank.

Speed at 2.5W: 25KPH
Power at 20KPH:
2.3-watts
Power Output Graph: HERE
Buffer Battery:
No
Price: €30 (139 zł)

In-Line: Ullmann Power Station 4

usb chargers

Ullmann Power Station 4 dynamo USB charger.

Speed at 2.5W: No data
Power at 20KPH:
 No data
Buffer Battery:
No
Price: US $130

In-Line: LightCharge2 Dynamo USB Charger

LightCharge2 dynamo USB charger.

Speed at 2.5W: No data
Power at 20KPH:
 No data
Buffer Battery:
No
Price: US $50

In-Line: VeloCharger USB GPS/Phone Charger

Speed at 2.5W: No data
Power at 20KPH:
 No data
Buffer Battery:
No
Price: US $85

In-Line: BioLogic ReeCharge Dynamo Kit

Biologic ReeCharge dynamo USB charger.

Speed at 2.5W: No data
Power at 20KPH:
No data
Buffer Battery:
No
Price: US $39

In-Line: Zzing Kit

dynamo usb

Zzing dynamo USB charger.

Speed at 2.5W: No data
Power at 20KPH:
No data
Buffer Battery:
2000mAh or 2700mAh (+€10)
Price: €99

Light: Spanninga Nomad

usb charger

Spanninga Nomad dynamo USB charger.

The Spanninga Nomad is, by far, the cheapest light and USB charger combo. It has a small form factor, with the USB plug hidden on the side of the lamp. It offers a lower 40 lux light output than the competition (compared to the B&M 90 lux and AXA 70 lux) but offers more USB power at 20KPH.

Speed at 2.5W: 18KPH
Power at 20KH:
 3.4-watts
Power Output Graph: HERE
Battery:
No
Price: US $50

Light: Sinewave Beacon

Sinewave Cycles Beacon

Sinewave Beacon dynamo USB charger.

The third dynamo USB charger from Sinewave is an LED light with 750 lumens output and an integrated switch for charging. The Beacon uses the same internals as the Revolution and Reactor so you can expect a strong smartphone charge at 17KPH. Interestingly, this light has a ‘Charger Priority Mode’ which will provide the minimum brightness to the LEDs and will send the rest of the power to the USB plug. Pretty cool! I’ve written a detailed article about the Sinewave Beacon light HERE.

Speed at 2.5W: 17KPH
Power at 20KPH:
3-watts
Power Output Graph: HERE
Battery: No
Price: US $350

Light: B&M Lumotec IQ2 Luxos

Busch und Muller Lumotec IQ2 Luxos Dynamo Light USB Charger

B&M Lumotec IQ2 Luxos dynamo USB charger.

Introduced to consumers at the 2012 Eurobike tradeshow, this 90lux dynamo light incorporates a handlebar switch and USB plug so that you can charge and ride. It’s a super neat and integrated design, however, comes with mixed reviews when it comes to its charging ability. Even so, this is a great dynamo light with a nice beam shape for on-road use.

Speed at 2.5W: No data
Power at 20KPH: 
No data
Battery:
No
Price: US $260

Light: AXA Luxx70 Plus

axa luxx70 plus

Axa Luxx70 Plus dynamo USB charger.

The AXA Luxx70 Plus is a similar product to the Lumotec IQ2 light, providing a handlebar switch to select between using the LED light or USB charger. The key advantage of this product is the exceptional price point. From all accounts, it works really well too.

Speed at 2.5W: No data
Power at 20KPH:
 No data
Battery:
No
Price: US $150

Learn About Hub Dynamo USB Chargers HERE, Dynamo Wiring Systems HERE, Cache Batteries HERE and Dynamo Lights HERE

The post List of Hub Dynamo USB Chargers and Charging Systems for Electronic Devices appeared first on CyclingAbout.com.

Fresh Updates For The Bikepacking and Touring Bicycle Buyer’s Guides!

$
0
0

November has been a crazy busy month for me.

I’ve spent almost every day researching the latest touring and bikepacking bikes, calculating various measurements, observing the latest trends, contacting bike manufacturers (for additional information), and updating all the terminology and general advice in my guides.

The guides are now brimming with the latest tech, and I have a tonne of data which I’m looking forward to sharing with you over the coming months.

There are now 25% more bikes in each of the guides for 2021, which is pretty impressive – bike travel is taking off! I’ve added some new sections here and there, including a few how-to guides on some neat web tools that will make comparing bikes even easier.

NEW: Bike-On-Bike Comparison Tool

Part of the reason why it took me so long to update everything is that I have uploaded the frame geometry data of EVERY bike from my guides onto the website Bike Insights.

If you haven’t seen this nifty web tool before, it allows you to visualise the frame geometry differences between two bikes. It is particularly useful when picking a bike size, as manufacturers do not have a standardised way of sizing them.

For example, take a look at the 61cm Bianchi Orso overlayed on the 56cm Kona Sutra LTD using this link. Given the sizing name, you’d think they’d be three sizes apart, but they actually measure up almost identically.

Another useful way to use Bike Insights is to borrow, hire, test or get professionally fitted to a bike that (a) feels good in terms of size, and (b) is already incorporated into the Bike Insights website. Then you can easily use that bike as a benchmark for comparing everything in my guides to pick the size that is a perfect match.

Bike Insights is awesome.

How To Get Your Copy

If you’re already one of my Buyer’s Guide customers, you should have just received the update email. If not, please check your ‘junk’ email folder as it might have been filtered.

Alternatively, you can search your email for your original “Gumroad” receipt. That will take you to the portal with the current Buyer’s Guide(s), along with Buyer’s Guides from previous years. Failing that, please get in contact with me using a private message on Facebook or Instagram – or via email.

If you’re a new customer, awesome! My guides will teach you everything about bikepacking or touring bikes, before allowing you to compare 220+ bikepacking bikes (and 190+ touring bikes) at the back of the books. These guides are updated yearly – for free – so you can always keep on top of the latest bikes and information.

You can get the Bikepacking Bike Buyer’s Guide HERE.
You can get the Touring Bicycle Buyer’s Guide HERE.

The post Fresh Updates For The Bikepacking and Touring Bicycle Buyer’s Guides! appeared first on CyclingAbout..

The Fascinating Aerodynamics of Bikepacking and Bicycle Touring

$
0
0

By the time you’re cycling at 30KPH, as much as 90% of the resistive force experienced comes from aerodynamic drag. And it’s not until you get down to 12KPH when rolling and air resistance are equal.

While most bicycle travellers do not travel at speeds above 20KPH, we still ride in places with headwinds, so I think we can all gain an advantage by thinking about aerodynamics.

Today, we’re going to take a close look at some interesting aero findings in the touring and bikepacking space, to understand how some small changes might allow us to travel further with less effort.

Super Basic Fluid Mechanics

Fluid mechanics is very complex, but if we distil it to the most basic elements relevant to bicycle touring, we end up with this drag equation:

Drag (D) consists of the air density (ρ), speed of the rider (V), frontal area (A) of the rider and the coefficient of drag (Cd).

For touring, it’s the coefficient of drag (Cd) and the frontal area (A) that we are looking to optimise when we ride our bikes. The Cd describes how aerodynamic the shape of an object is, and it’s not a fixed value – it changes depending on our touring speed, the surface textures and the air density.

Here are some approximate drag coefficients of different objects:

And here are some drag coefficients of different riding positions to compare:
1.10 – Rider sitting upright (yep, you’re as aerodynamic as a cube)
0.85 – Rider in the drops (ok, now you’re an angled cube)
0.70 – Rider in a time trial position (sorry, you’re still an angled cube)
0.10 – Fastest recumbent bicycle (finally, you’re streamlined!)

When we multiply the coefficient of drag (Cd) with the frontal area (A), we find out the CdA, or amount of drag per unit of area. To reduce our CdA, we can make our shape more aerodynamic (Cd), our frontal area smaller (A) – or both.

To get the unified hour record, it is estimated that a cyclist needs to have a CdA less than 0.2, and you need a CdA ten times less (0.02) to get the recumbent hour record!

My Velodrome Test

Five years ago, I was interested to find out what would happen if I adjusted the frontal area (A) of my luggage setup.

I conducted a test to find out the speed difference between bikepacking bags, front panniers, rear panniers and both. With a power meter fitted to my bike so I could pedal at exactly 200 watts, I cycled around a velodrome for a whole day with different bag setups to create data that was statistically significant.

The results were pretty interesting. With a higher-than-average touring speed (30KPH), two large front panniers were 6.4% slower than bikepacking bags, two large rear panniers were 6.5% slower, and a complete pannier set was 7.9% slower.

As these speeds are faster than most people travel, I would like to conduct this test again between 20 and 25KPH and I’d also like to try it with a larger volume bikepacking handlebar pack.

Cycling 100KM @ 30KPH with bikepacking bags:
Large Front Panniers: 6.4% slower (12:48 slower over 100km)
Large Rear Panniers: 6.5% slower (13:00 slower over 100km)
Front and Rear Panniers: 7.9% slower (15:48 slower over 100km)

Francis Cade’s Wind Tunnel Testing


Wind tunnels are commonly used to accurately compare the aerodynamic properties of different objects.

But one of the issues in the accuracy of the data is that the wind arrives in a steady-state, whereas wind, when you’re out cycling, is often much more turbulent. In addition, there is no ground speed in a wind tunnel and the rider is fixed in place.

A technology that might provide better data for outside conditions is aero rakes, which are commonly used in Formula 1. They can measure the flow of air behind a rider in real-time, so it will be interesting to see where this technology goes in cycling.

Back to wind tunnels – even with the inaccuracies, we can still learn information about how different luggage setups likely affect your speed.

Francis Cade made a luggage aero testing video and found a less than 1% reduction in speed when he added two bottles to his fork. With a handlebar bag added in as well, it reduced his speed by a bit over 2%. Then when he added a bikepacking seat pack – it actually made him a touch faster, likely because the airflow was separating cleaner behind his body. And the complete ensemble with panniers made him 3.6% slower, which works out to be almost 9 minutes over 100km.

Cycling 100km @ 25KPH:
Two bidons on the fork – 0.7% slower (1:45 slower over 100km)
Two bidons and a front handlebar pack – 2.1% slower (4:57 slower over 100km)
Two bidons, front handlebar pack and seat pack – 1.5% slower (3:30 slower over 100km)
Two bidons, front handlebar pack, seat pack and rear panniers – 3.6% slower (8:45 slower over 100km)

Specialized Win Tunnel Testing

Specialized has a lot of wind tunnel videos on their YouTube channel, and there are two interesting results relevant to touring.

The first is with regards to your hand positions on a flat handlebar. Most people ride in the grips, but if you can comfortably move your hands inwards near the stem and flatten your arms, that is worth a 6% gain in speed at 26KPH.

Cycling 100km @ 26KPH:
Hands in the grips – 6.2% slower (14:53 minutes slower over 100km)

The second is the difference between baggy and fitted cycling clothing. The numbers here suggest your choice of clothing is almost as important as your luggage setup, which makes sense, as your body makes up the largest percentage of your frontal area, and the drag is higher on a flappy surface.

Cycling 100km @ 30KPH:
Baggy Clothes – 5% slower (10:00 slower over 100km)

Bicycle Quarterly Wind Tunnel Testing

Bicycle Quarterly has also tested different bike and gear setups in a wind tunnel.

At 32KPH, they found that the difference between a close-fitting jacket and a looser rain jacket is an 8% difference in terms of wind resistance, which according to my estimations is around 2% slower cycling speeds.

Want to lift your bars 20mm higher? That’ll cost you 1.5% from your baseline speed.

Cycling 100km @ 32KPH/20MPH:
Raising the handlebar by 20mm results in 5% more wind resistance: ~1.5% slower (3:04 slower over 100km)
Wearing a loose rain jacket results in 8% more wind resistance: ~2.3% slower (4:30 slower over 100km)

Bicycle Quarterly also found a handlebar bag was more aerodynamic than a saddlebag, and that while a front fender reduced drag, the rear fender increased it – resulting in no overall drag penalty.

Fenders Make Your Bike MORE Aerodynamic!?

Speaking of fenders, an interesting paper came out last year, suggesting that fitting fenders/mudguards to your bike will make it more aerodynamic.

The idea is that the upper part of the fender shields the forward spinning portion of the wheel, which reduces the turbulence of the air behind the wheel, and therefore, the drag of the bike.

The study suggests that fenders with specifically 135 degrees of coverage are the sweet spot between a reduction in the drag coefficient (Cd) without too big an increase in the frontal area (A). But any longer and the larger frontal area tips this balance.

Based on my calculations, the 4.5% reduced Cd would mean that fenders could be 0.9 to 1.6% faster between 22 and 36KPH.

But this study was conducted using computational fluid dynamics, or CFD. In the bike world at least, CFD is considered more problematic than other forms of aerodynamic testing because it’s really hard to account for things like moving spokes, rotating legs and turbulent airflow.

With a 4.5 to 4.6% reduction in the Cd:
21.6KPH to 21.79KPH – 0.9% faster
28.8KPH baseline to 29.12KPH – 1.1% faster
36KPH baseline to 36.6KPH – 1.6% faster

Someone Actually Made Aero Fenders!

Some companies have actually brought wheel-shielding fenders to the market – but unfortunately, there is no independent data that I could find to verify whether they work as claimed.

Null Winds boasts claims as big as 20% faster when you’re cycling into a headwind with their fenders, which to me, sounds a bit too good to be true. Birzman also teased an aero fender set which was said to improve the wheel’s Cd by almost 4% at 48KPH, but this concept never made it to market.

Another interesting example of front-wheel shielding is found on the Ceepo Shadow R time trial bike. Again, there is no data available, which suggests to me that while some aspects of the aerodynamics might be improved, there are likely some negative downstream effects.

And lastly, we have a study by SQlab who wanted to find out whether there was a performance advantage using their Innerbarends. While riding at 36KPH on a velodrome, they found a 14-watt power difference between the Innerbarends and the grips of a flat handlebar. This works out to be a 1.8% difference in speed at the same power output.

The Savings Biggest-To-Smallest

Front and rear panniers7.9% slower than bikepacking bags @ 30KPH
Two large rear panniers6.5% slower than bikepacking bags @ 30KPH
Two large front panniers – 6.4% slower than bikepacking bags @ 30KPH
Hands in the grips, riding upright – 6.2% slower than hands near the stem, arms flat @ 26KPH
Baggy cycling clothes5% slower than fitted cycling clothes @ 30KPH
Two bidons, front handlebar pack, seat pack and rear panniers3.6% slower than no luggage fitted @ 25KPH
Loose rain jacket – 2.3% slower than a tight rain jacket @ 32KPH
Two bidons and a front handlebar pack2.1% slower than no luggage fitted @ 25KPH
Riding in the grips – 1.8% slower than Innerbarends @ 36KPH
Two bidons, front handlebar pack and seat pack1.5% slower than no luggage fitted @ 25KPH
20mm higher handlebars1.5% slower than baseline speed @ 32KPH
A bike without fenders0.9 to 1.6% slower than a bike with 135-degree fenders @ 22-36KPH
Two bidons on the fork  – 0.7% slower than no luggage fitted @ 25KPH

Note: these results are not directly comparable due to the different test protocols and speeds, but it’s still interesting to see how they might rank!

Summary

Ok, so if wind tunnels, CFD and outdoor testing are all somewhat problematic, what can we take home from this?

We really just have to go back to the theory. Reducing the frontal area of your luggage will help you travel faster with the same power output. The more luggage you can jam in-line with your bike, the better – we’re talking frame packs, seat packs, top tube bags and even the area under your downtube.

Tighter fitting clothes are always going to be beneficial as the shape itself is more aerodynamic and the frontal area is smaller too.

If your body is conditioned for it, you can reduce your frontal area by changing your body position on the bike. Using my KOGA Denham Bars, I can put my hands near my stem or in my bullhorns to change my CdA – allowing me to go noticeably faster.

Or alternatively, we could all just ride aerodynamically-superior recumbent bicycles.

The post The Fascinating Aerodynamics of Bikepacking and Bicycle Touring appeared first on CyclingAbout..

How Much Do Hub Dynamos Really Slow You Down?

$
0
0

I have used and recommended dynamo setups for over a decade as I love not having to think about charging battery lights or sourcing power for my devices.

You will often hear remarks like ‘my dynamo hub doesn’t slow me down at all’. While it may not feel that way, there is always a cost when it comes to bicycle power production, and today, I’ll tell you how much dynamo drag will likely slow you down.

Finding the exact number is surprisingly tricky. It depends on dozens of factors including (but not limited to) rider weight, fitness level, bike weight, wheel size, tyre width, road surfaces, cycling speed – and the specific hub, charger and lights that are fitted to your bike.

To get a sense of the drag, I will be creating two different rider scenarios and running them on both flat and 5% road gradients. We will then calculate the speed differences of both the highest and lowest-drag hubs when paired with different USB chargers and dynamo lights.

Let’s start with a quick overview of the dynamo components.

The Components That Make A Dynamo Setup

Hub Dynamo
Hub dynamos generate power by passing magnets over a copper coil, and it is here where the physical drag occurs. Hubs actually vary a surprising amount in terms of both power output and efficiency, you’ll be able to see the lowest-drag hubs on some graphs below.

USB Chargers
USB chargers convert the power from your hub into a useable form at the USB plug. Depending on how the electronics have been designed, there are power output and efficiency differences here too. But importantly, the resistance at the wheel is based on how much power your plugged-in device is drawing from the hub, and this can vary quite a bit. For example, a Garmin GPS at 25KPH would likely have 6 or 7x less resistance than a big smartphone.

Dynamo Lights
When it comes to lighting, brighter lights will typically slow you down more than dimmer lights. Most dynamo lights achieve their maximum brightness (and therefore drag) between 15 and 20KPH. Personally, I think lighting is the number one reason someone should use a dynamo setup – they’re just so convenient.

My Two Cyclists

For today’s estimations, we will look at two different rider scenarios.

The smaller rider weighs 60kg and their bike plus gear is 25kg. As the average cyclist pedals at around two watts-per-kilogram on a long ride, this rider will be pushing 120-watts for the simulation.

The bigger rider is 90kg and their bike plus gear is also 25kg. They will pedal their bike at 180-watts.

Dynamo Drag Data And Calculations

I am using dynamo power and drag data collected on Skjegg Blogspot. You can find links to the original test HERE and my interpretation of the results HERE.

I have then used Bike Calculator to determine the speed differences at different power outputs. Through my own real-world testing, I have found this tool to work with very high accuracy.

Hub Dynamo With Nothing Connected

tout terrain silkroad

Let’s start with the hub drag with nothing connected. This graph shows the drag of four different dynamo hubs at speeds between 5 and 30KPH. You will notice that most hubs increase in resistance the faster you go; the exception is the Schmidt SON28 which has some black magic going on to achieve a somewhat steady drag at different riding speeds.

Speed difference on the flat:
Smaller cyclist with no dynamo hub – 21.70KPH
Smaller cyclist with the lowest-drag hub – 21.61KPH – 0:14 behind per hour (0.4% slower)
Smaller cyclist with the highest-drag hub – 21.37KPH –  0:54 behind per hour (1.5% slower)
Bigger cyclist with no dynamo hub – 24.62KPH
Bigger cyclist with the lowest-drag hub – 24.56KPH – 0:07 behind per hour (0.2% slower)
Bigger cyclist with the highest-drag hub – 24.32KPH – 0:43 behind per hour (1.2% slower)

Speed difference on a 5% climb:
Smaller cyclist with no dynamo hub – 7.77KPH
Smaller cyclist with the lowest-drag hub – 7.71KPH – 0:29 behind per hour (0.8% slower)
Smaller cyclist with the highest-drag hub – 7.68KPH – 0:43 behind per hour (1.2% slower)
Bigger cyclist with no dynamo hub – 8.64KPH
Bigger cyclist with the lowest-drag hub – 8.59KPH – 0:22 behind per hour (0.6% slower)
Bigger cyclist with the highest-drag hub – 8.56KPH – 0:32 behind per hour (0.9% slower)

Note: for my comparisons, I am subtracting the expected drag of a high-quality hub from all rider scenarios – that’s 0.25-watts at low speeds, 0.5-watts at high speeds.

Hub Dynamo With A Light Connected

ahearne pinion gearbox

For this scenario, we’ll be looking at how much a very bright 100lux dynamo light will slow you down. I have selected the data from the B&M IQ-X, which is one of the brightest options available and one that I personally recommend.

Speed difference on the flat:
Smaller cyclist with no dynamo hub – 21.70KPH
Smaller cyclist with the lowest-drag hub – 20.75KPH – 2:38 behind per hour (4.4% slower)
Smaller cyclist with the highest-drag hub – 20.39KPH – 3:36 behind per hour (6.0% slower)
Bigger cyclist with no dynamo hub – 24.62KPH
Bigger cyclist with the lowest-drag hub – 23.89KPH – 1:48 behind per hour (3.0% slower)
Bigger cyclist with the highest-drag hub – 23.64KPH – 2:24 behind per hour (4.0% slower)

Speed difference on a 5% climb:
Smaller cyclist with no dynamo hub – 7.77KPH
Smaller cyclist with the lowest-drag hub – 7.53KPH – 1:52 behind per hour (3.1% slower)
Smaller cyclist with the highest-drag hub – 7.28KPH – 3:47 behind per hour (6.3% slower)
Bigger cyclist with no dynamo hub – 8.64KPH
Bigger cyclist with the lowest-drag hub – 8.40KPH – 1:41 behind per hour (2.8% slower)
Bigger cyclist with the highest-drag hub – 8.16KPH – 3:22 behind per hour (5.6% slower)

Note: for my comparisons, I am subtracting the expected drag of a high-quality hub from all rider scenarios – that’s 0.25-watts at low speeds, 0.5-watts at high speeds.

Hub Dynamo With A USB Charger Connected

We will be using a kLite USB charger for this example, and we will be assuming that your device is consuming all power available at the USB port. Keep in mind that hub dynamos also vary in power output at the same speed – more power results in more drag. As the Shimano UR700 provides 25% more power at the USB plug than the SON hub, this is not a perfectly fair comparison.

On the 5% climb, I cannot simulate the SON28 as it’s not yet making good power with the kLite charger, so we will compare the two Shimano hubs instead.

Speed difference on the flat (UR700 vs SON28):
Smaller cyclist with no dynamo hub – 21.70KPH
Smaller cyclist with the lowest-drag hub – 21.15KPH – 1:30 behind per hour (2.5% slower)
Smaller cyclist with the highest-drag hub – 20.66KPH – 2:53 behind per hour (4.8% slower)
Bigger cyclist with no dynamo hub – 24.62KPH
Bigger cyclist with the lowest-drag hub – 24.13KPH – 1:12 behind per hour (2.0% slower)
Bigger cyclist with the highest-drag hub – 23.66KPH – 2:20 behind per hour (3.9% slower)

Speed difference on a 5% climb (UR700 vs 3D32):
Smaller cyclist with no dynamo hub – 7.77KPH
Smaller cyclist with the Shimano 3D30 hub – 7.76KPH – 0:04 behind per hour (0.1% slower)
Smaller cyclist with the Shimano UR700 hub – 7.46KPH – 2:24 behind per hour (4.0% slower)
Bigger cyclist with no dynamo hub – 8.64KPH
Bigger cyclist with the Shimano 3D30 hub – 8.61KPH – 0:11 behind per hour (0.3% slower)
Bigger cyclist with the Shimano UR700 hub – 8.38KPH – 1:48 behind per hour (3.0% slower)

Note: for my comparisons, I am subtracting the expected drag of a high-quality hub from all rider scenarios – that’s 0.25-watts at low speeds, 0.5-watts at high speeds.

Bonus: Predicting Time Loss With A More Powerful USB Charger

dynamo usb charger

I personally use a Cinq Plug5 Plus USB charger and Schmidt SON28 hub dynamo on my bike, so I’m running these predictions more for my own curiosity than anything else.

Using the Schmidt hub charging efficiencies from the kLite graph above and the power output figures of the Plug5 Plus from some other independent testing, I can crunch the numbers to try to predict what my more powerful USB charger will likely cost our two simulated riders.

Speed difference on the flat:
Smaller cyclist with no dynamo hub – 21.70KPH
Smaller cyclist with the Schmidt SON28 hub – 20.89KPH – 2:13 behind per hour (3.7% slower)
Bigger cyclist with no dynamo hub – 24.62KPH
Bigger cyclist with the Schmidt SON28 hub – 23.98KPH – 1:34 behind per hour (2.6% slower)

Speed difference on a 5% climb:
Smaller cyclist with no dynamo hub – 7.77KPH
Smaller cyclist with the Schmidt SON28 hub – 7.57KPH – 1:34 behind per hour (2.6% slower)
Bigger cyclist with no dynamo hub – 8.64KPH
Bigger cyclist with the Schmidt SON28 hub – 8.48KPH – 1:08 behind per hour (1.9% slower)

Drag/efficiency figures for these calculations:
kLite efficiency @ 24.6KPH = 59.7% —–> Cinq Plug5 Plus @ 24.62KPH = 5.2-watts —–> Drag is 8.7-watts
kLite efficiency @ 21.7KPH = 57.4% —–> Cinq Plug5 Plus @ 21.70KPH = 4.8-watts —–> Drag is 8.4-watts
kLite efficiency @ 8.64KPH = 28.6% —–> Cinq Plug5 Plus @ 8.64KPH = 0.95-watts —–> Drag is 3.3-watts
kLite efficiency @ 7.77KPH = 28.6% —–> Cinq Plug5 Plus @ 7.77KPH = 0.95-watts —–> Drag is 3.3-watts

How Much Does Dynamo Drag Slow You Down?

The most-efficient hub will slow you down:
10-30 seconds per hour with no lights or chargers attached
1-2 minutes per hour with a USB charger
1.5-2.5 minutes per hour with a bright light

The least-efficient hub will slow you down:
0.5-1 minute per hour with no lights or chargers attached
2.5-3 minutes per hour with a USB charger
2.5-4 minutes per hour with a bright light

Hub dynamos run well with nothing connected. On the flat, my Schmidt hub is probably slowing me down only 7-seconds per hour.

When charging a smartphone, I am likely losing around 1.5 minutes per hour, which I think is very reasonable given how convenient it is to always have power on tap. A low-power device like a Garmin GPS would likely cost me around 20 seconds per hour in comparison.

That said, dynamo lights are my number one reason for using a dynamo setup, and I’m happy to lose a couple of minutes per hour at night for sheer convenience. But if I was ultra racing at the pointy end of the field, this data would make me consider whether I can get by with battery-powered lights, as I could potentially save 25-40 minutes in an overnight push – which is a decent nap!

When an ultra course allows for it, less bright dynamo lights could be a better option. The B&M Cyo, which is half the brightness of the light we simulated (B&M IQ-X), would probably cost around a minute per hour when paired with the Schmidt SON28 hub.

You Can See All Of My Dynamo Resources Listed HERE

The post How Much Do Hub Dynamos Really Slow You Down? appeared first on CyclingAbout..

List of Rohloff Bike Models For Touring and Bikepacking

$
0
0

I’ve been writing about internal gear hubs for close to a decade, and a list of Rohloff bike models has long been requested.

The main reason I have refrained from compiling this list is that Rohloff hubs can be retrofit to almost any bike – so any bike can technically be a Rohloff bike! There are many ways to tension the chain, manage the cables or secure the hub in any frame.

That said, a dedicated Rohloff bike is very nice to have.

Dedicated frames have Rohloff cable guides from the head tube to the hub (sometimes they’re even guided internally), along with a special rear dropout that makes installing your wheel particularly easy. Additionally, you can easily tension the chain or belt – typically via an eccentric bottom bracket or sliding rear dropouts.

Speaking of belts, almost all Rohloff bikes are now belt drive compatible. A belted frame requires a super-stiff rear triangle to keep the belt on the cog, and a splitter in the rear triangle to install the one-piece belt. Those that have been reading my articles for a while will know that I think belts are the ultimate drivetrain for bike travel.

Ok, let’s take a look at (almost) every Rohloff bike model currently available. Please note that I’m using complete bike models for this list.

Touring – Rohloff Bike Models (Flat Bar)

Rohloff Bike

Aarios Expedition
Switzerland
from €5900
Website

Avaghon X29, S28, S26, Racer
The Netherlands
from 3495
Website

Contoura AL-6
Germany
from 2799
Website

Rohloff Bike

Externum Genuin Premium
Germany
from €2900
Website

Faible Allegro Rohloff
Germany
from 2599
Website

Falkenjagd Hoplit ST

Falkenjagd Hoplit ST*
Germany
from 6543
Website

Rohloff Bike

Gudereit SX-R 4.0 evo
Germany
from €2699
Website

Herkelmann Amerigo
Germany
from 2975
Website

titanium touring bike

HILITE Adventure Touring*
Switzerland
from CHF6500
Website

titanium touring bike

Horizon Quest
Latvia
from 5649
Website

rohloff bike

Idworx All Rohler, All Rohler Ti
Germany
from 5095
Website

Intec M05
Germany
from 2499
Website

Rohloff Bike

Kocmo R-2 EBB
Germany
from €5460
Website

2020 Koga WorldTraveller

KOGA WorldTraveller-S
The Netherlands
from 3500
Website

MaxCycles Steel Lite 2
Germany
from €2959
Website

Belt Drive Touring Bike

Maxx Crossmaxx 28*
Germany
from €3129
Website

Rohloff Bike

Norwid Aaland, Kattegat, Funen*
Germany
from €3300
Website

rohloff bike

Nua Luna
Spain
from €4365
Website

Rohloff Bike

Oxford Bike Works Rohloff Tour
United Kingdom
from £2699
Website

Rohloff Bike

Patria Kosmos, Terra
Germany
from €3556
Website

Rohloff Bike

Pilot Vamos*
The Netherlands
from €4999
Website

Rohloff Bike

Poison Morphin, Phosphor
Germany
from €2549
Website

Rohloff Bike

Rennstahl Reiserad 853, 931
Germany
from €4390
Website

Rohloff Bike

Rose Activa Pro Rohloff
Germany
from €3499
Website

Santos Travelmaster, Crosslite
The Netherlands
from €4400
Website

Rohloff Bike

Schauff Sumo R14
Germany
from €€€
Website

Rohloff Bike

Snel Steel Ride
The Netherlands
from €5699
Website

rohloff bike

Stanforth Kibo Rohloff
United Kingdom
from £3200
Website

Rohloff Bike

Thorn Nomad, Mercury, Raven
United Kingdom
from £2545
Website

Rohloff Bike

Tout Terrain Silkroad, Tanami
Germany
from €3990
Website

Rohloff Bike

Trenga GLC 14, 15, 16
Germany
from €2599
Website

Rohloff Bike

Van Nicholas Pioneer, Amazon
The Netherlands
from €4499
Website

Rohloff Bike

Velotraum VK10
Germany
from €3500
Website

Rohloff Bike

Vivente Stirling, The Gibb
Australia
from AU $4850
Website

Rohloff Bike

VSF TX-1000, T-900
Germany
from €3399
Website

Touring – Rohloff Bike Models (Drop Bar)

Co-Motion Americano, Siskiyou, Pangea*
United States
from $5560
Website

Rohloff Bike

Maxx Crossmaxx 28*
Germany
from €3129
Website

Rohloff Bike

Rod Bikes MakeShift
United States
from $4699
Website

Rohloff Bike

Shand Stoater, Stooshie
United Kingdom
from £3995
Website

Rohloff Bike

Sven Wayfarer
United Kingdom
from £5900
Website

Rohloff Bike

Vivente Swabia
Australia
from AU$4900
Website

Off-Road – Rohloff Bike Models

Rohloff Bike

Co-Motion Divide Rohloff*
United States
from $5560
Website

Idworx Rohler BLT, Rohler BLT Ti
Germany
from 5195
Website

Rohloff Bike

Kocmo MCM Expedition
Germany
from €6000
Website

Rohloff Bike

KOGA WorldTraveller-S
The Netherlands
from €3500
Website

Rohloff Bike

Shand Bahookie Rohloff
United Kingdom
from £3995
Website

Rohloff Bike

Shand Tumshie, Tam
United Kingdom
from £4295
Website

Rohloff Bike

Tumbleweed Prospector
United States
from $4450
Website

Rohloff Bike

Van Nicholas Zion Rohloff
The Netherlands
from €5099
Website

Trekking – Rohloff Bike Models

Rohloff Bike

Gudereit LC-R 4.0 evo
Germany
from €2899
Website

Mountain Bike – Rohloff Bike Models (Suspension)

Rohloff Bike

Maxx Racemaxx 29, 650B, 26
Germany
from €3329
Website

Rohloff Bike

Curve Engineering 269
France
from €5140
Website

Rohloff Bike

Falkenjagd Hoplit ST
Germany
from €6345
Website

Rohloff Bike

Mi-Tech Tyke, Szenario, Druid
The Netherlands
from €TBC
Website

Rohloff Bike

Nicolai G1 EBOXX E14 Speed (eBike)
Germany
from €9499
Website

Rohloff Bike

Rennstahl 853 MTB
Germany
from €4050
Website

Rohloff Bike

Riese & Müller Delite Mountain (eBike)
Germany
from €7600
Website

Tandem – Rohloff Bike Models

Rohloff Bike

Co-Motion Java
United States
from $7195
Website

Thorn Raven Tandem
United Kingdom
from £3999
Website

Folding – Rohloff Bike Models

Rohloff Bike

Bike Friday New World Tourist
United States
from $TBC
Website

Birdy Rohloff
Germany
from €3600
Website

Leave a comment with any Rohloff bike models I may have missed, and I’ll add them in the next update. Please note: this list is for complete Rohloff bikes.

The post List of Rohloff Bike Models For Touring and Bikepacking appeared first on CyclingAbout.

Here Are The 13 BEST Bikepacking Bikes For 2021

$
0
0

It’s time for my take on the best bikepacking bikes for 2021.

In this super in-depth article, I’ll first explain how I went about selecting these bikes. I’ll then discuss the different bike categories, and finally, we will look at all of the bikes that stand out to me.

I have made this resource particularly informative so that you can learn some cool stuff, and apply my knowledge to any bike – new or second hand, expensive or cheap.

I’m using my Bikepacking Bike Buyer’s Guide to compare and select all of these bikes. The book goes into every detail about bikepacking bikes, before allowing you to compare over 220 current models at the back of the book. Don’t worry about it going out-of-date, it’s updated yearly for free.

How Did I Select The Best Bikepacking Bikes?

Frame Geometry

I first assessed the frame geometries for each of these bikes to see whether they are suitable for the bike’s intended use. I was looking for bikes that are stable to ride, more upright than typical and with the appropriate steering characteristics for the expected terrain.

Low Climbing Gears

I next looked at the lowest climbing gear on each of the bikes. If you don’t have a low enough climbing gear, you simply struggle more than necessary.

We will use gear inches to compare the climbing gears on different bikes. This is the diameter of the wheel, times the size of the front chainring and divided by the size of the rear cog. With this information, we can compare bikes with different wheel sizes and drivetrain setups.

Don’t worry about the fact that we’re talking in inches – I just prefer the double or triple-digit numbers that it spits out. All you really need to know is that lower is always better, and the benchmark for off-road is less than 20 gear inches, and for gravel, it’s less than 24 gear inches.

Gear inches are also relative: a bike with a 10% smaller number will climb 10% slower using the same RPM.

Maximum Tyre Widths

There are very few downsides to having a bike that can clear wide tyres, so I have prioritised any models with more generous clearances within their bike category.

Price/Value

And lastly, I have narrowed the options down to the point where you get the most performance for your money. If these prices are too high for your budget, you should look for an older version of these bikes second-hand.

Bikepacking Bike Categories

Each of my bike picks represents a different bike category.

29″ Plus bikes use the largest diameter rim and wide 3.0″ tyres.
27″ Plus bikes have the same tyre footprint but the wheel diameter is smaller.
Plus Hardtail bikes are designed to be more fun on trails, using suspension forks and dropper posts.
Full Suspension bikes employ front and rear suspension to maintain excellent traction and make rough trails a breeze.
Fat bikes are snow and sand specialists, with the ability to fit 5” wide tyres.
Mid-Fat bikes are the middle ground between a plus and fat bike.
29″ Flat Bar bikes employ a more agile mountain bike frame geometry and mountain bike tyres wider than 2.1″.
29″ Drop Bar bikes are the curly bar version.
27.5″ Gravel bikes use smaller mountain bike wheels but with 50mm or wider tyres.
27.5″ Gravel (Ultralight) is the weight-optimised version.
700C Gravel bikes are the fastest on smoother surfaces, using 40-50mm wide tyres.
700C Gravel (Ultralight) is the weight-optimised version.
700C Gravel (All-Round) is both weight and tyre clearance optimised.

Coronavirus Supply Chain Issues

One last note, there is some unfortunate news about buying bikes this year – COVID has wreaked havoc on the bike supply chain, and there is also unprecedented demand for bikes. This means that you might not actually get your hands on some of these bikes immediately, and will likely have to wait.

The Best Bikepacking Bikes For 2021

29 Plus – Jones Plus LWB ($2099)

best bikepacking bikes

Let’s start with the Jones Plus LWB (long wheelbase), which is a unique bike even within the 29+ category.

Jones take a regular plus bike but stretch out both the front and rear centres. As both ends of the bike are longer, you end up with similar weight distribution on the tyres.

There are two big advantages to this design:
(1) The longer wheelbase provides more stability at speed, which will keep your bike more composed on rougher terrain.
(2) You can more comfortably climb steeper gradients with the longer chainstays. This is because the looping angle at the back of the bike increases, meaning your front wheel will stay planted even on the steepest ascents.

The disadvantages to long chainstay bikes are that it’s harder to lift the front wheel over obstacles, and the bike is a bit less agile on tight, twisty trails. The way I see it, tight trails usually make up a very small percentage of any bikepacking route – so optimising around stability is probably the way to go.

The Jones is my 29+ pick because it’s priced well, it has low gear ratios for climbing and it’s running appropriately wide rims for its 3-inch tyres. The steering is quicker than most plus bikes, which will help change direction with a moderate front load. It also has more than enough mounts for cargo cages and even racks and fenders.

The only change I’d recommend is an upgrade to some hydraulic brakes.

Jones Plus LWB vs. Plus Category Average
Weight:
~15.3kg – Category 14.1kg (9% more than average)
Steering Speed: 83mm – Category 93mm (11% faster than average)
Low Climbing Gear: 18 gear inches – Category 19 gear inches (5% lower than average)

27 Plus – Sonder Frontier SX (£799)

best bikepacking bikes

The Sonder Frontier is an excellent value plus bike. According to Sonder, this bike tips the scales at 12.2kg/26.9lb which is substantially lighter than almost all other plus bike offerings. This low weight and great value are thanks to the unrivalled price-to-weight ratio of an aluminium frame and fork, which usually saves 1.0-1.5kg over the equivalent steel offering.

The Frontier is using a SRAM 1X drivetrain with the same 18-inch climbing gear as the Jones. Unlike the Jones, the frame geometry is more on the playful end of things, so you can expect it to ride with more agility.

It’s worth noting that you can get the frameset for £299, and the wheels for £179, which would be a great place to start on a custom build. You can also get the complete bike with 29″ wheels and a suspension fork if you’re after something that is more optimised around recreational mountain biking.

Sonder Frontier vs. Plus Category Average
Weight:
12.2kg – Category 14.1kg (13% less than average)
Steering Speed: 93mm – Category 93mm (same as average)
Low Climbing Gear: 18 gear inches – Category 19 gear inches (5% lower than average)

Plus Hardtail – Salsa Timberjack XT ($1999)

best bikepacking bikes

If you’d prefer to have a more multipurpose mountain bike – for the money, I don’t know if you can do better than the Salsa Timberjack XT.

This bike offers a suspension fork with 130mm of travel (which you can lockout) along with a dropper seatpost. These two components alone will transform any plus bike into a trail-shredding machine, allowing you to take on much rougher, steeper and more technical terrain than usual.

The downside to these components is the need to service them – RochShox forks call for a 50-hour service interval for the lower legs and 200 hours for a full strip and rebuild.

The climbing gear is 18 gear inches which is great for bikepacking, and shifting will be sublime given the bike has been specced with a Shimano XT shifter and derailleur.

One of the nicest things about Salsa bikes is that many models have perfectly-fitting frame packs available, and the Timberjack is no exception.

Salsa Timberjack vs. Plus Category Average
Weight:
13.9kg – Category 14.1kg (1% less than average)
Steering Speed (Trail): 106mm – Category 93mm (14% slower than average)
Low Climbing Gear: 18 gear inches – Category 19 gear inches (5% lower than average)

Full Suspension – Kona Hei Hei ($2599)

best bikepacking bikes

For rough terrain and all-round mountain bike fun, it’s hard to beat a full suspension bike. The suspension allows you to tackle the same technical terrain as a plus bike, but with lighter, narrower and faster rolling tyres – it’s also the fun-est to ride on singletrack, in my opinion.

The model that stands out most to me this year is the Kona Hei Hei. It has a decent space for a custom frame pack, along with the new Shimano Deore 12 speed drivetrain (with an 18″ climbing gear), a long dropper seatpost and 29 x 2.5″ tyre clearance.

Kona Hei Hei vs. Full Suspension Category Average
Weight:
~14.2kg – Category 13.6kg (4% more than average)
Steering Speed: 97mm – Category 103mm (6% faster than average)
Low Climbing Gear: 18 gear inches – Category 18 gear inches (same as average)

Fat Bike – Salsa Mukluk ($1699)

best bikepacking bikes

For loose surfaces like sand or snow, you need maximum tyre floatation – and that’s where the wider 26″ fat bike tyres still hold the advantage when compared to narrower 27.5″ fat bikes.

The best value 26″ fat bike this year is the aluminium Salsa Mukluk. It comes stock with 4.6″ tyres but will squeeze in a 4.8″ if you need. The drivetrain is the new Shimano Deore 11-speed with an 18″ climbing gear.

As usual, you can order your bike with a perfectly-fitting frame pack, and the Mukluk has all the provisions to carry a bikepacking bag ensemble or rear panniers if you need the volume.

Salsa Mukluk vs. Fat Bike Category Average
Weight:
15.0kg – Category 13.9kg (8% more than average)
Steering Speed – 97mm – Category 94mm (3% slower than average)
Low Climbing Gear – 18 gear inches – Category 18 gear inches (same as average)

Mid Fat – Otso Voytek ($3400)

best bikepacking bikes

If you do not need the massive tyre float of the Mukluk, you can use a mid-fat bike that’s a bit more well-rounded on different surfaces. The full-carbon Otso Voytek may be the most expensive in this list, but at 11.5kg/24.5lb, it’s light, and it comes with some unique features.

While most fat bikes have a very wide crank distance between the pedals, the Otso is a just 10mm wider than normal. This reduces knee strain by bringing the pedals closer together, and it provides extra cornering clearance too.

The Voytek is able to adapt to different wheel sizes using special sliding dropouts which change both the chainstay length and the bottom bracket height. This means you compromise much less than normal when choosing between regular mountain bike tyres, 3.0” plus tyres, 4” mid-fat tyres or a full-fat set up like you see pictured.

The entry-level Voytek comes with Shimano SLX gearing, but you can configure the bike from the ground up in the Otso configurator.

Bike Snapshot vs. Fat Bike Category Average
Weight:
11.5kg – Category 13.9kg (17% less than average)
Steering Speed: 92mm – Category 94mm (2% faster than average)
Low Climbing Gear: 19 gear inches – Category 18 gear inches (5% higher than average)

29″ Flat Bar – Marin DSX2 ($1149)

best bikepacking bikes

Let’s move onto something a little bit quicker on smoother surfaces.

I’m all about the new Marin DSX2. It’s insane-value at $1149, with the latest 12-speed Shimano Deore drivetrain, a full carbon fork, hydraulic brakes, and a lightweight aluminium frame.

There is clearance for a 2.1″ tyre, so this is not quite as versatile as other bikes in this category (which will fit up to 2.5″). But you’ll find that 2.1″ is ample width for most gravel surfaces.

You can expect the DSX2 to tip the scales at around 11kg/24lb, making it especially light for its price.

Bike Snapshot vs. 29″ Category Average
Weight:
~10.9kg – Category 11.9kg (8% less than average)
Steering Speed: 80mm – Category 79mm (1% slower than average)
Low Climbing Gear: 24 gear inches – Category 24 gear inches (same as average)

29″ Drop Bar – Riverside 920 (€1499)

best bikepacking bikes

If you’ve decided that drop bars are what your 29er requires, the new Riverside 920 is where the value is at.

This aluminium bike is 12.7kg and has been designed for moderate off-road terrain. It has a lower climbing gear than the average bike in this category, it will squeeze in wide 2.4″ tubeless tyres, and it’s running a SRAM 1×11 drivetrain and hydraulic disc brakes.

This is also the only bike on this list that comes with a dynamo hub and USB charger, which I’m pretty stoked on.

You will find the Cycle2Charge USB plug integrated neatly into the steerer tube. This unit is actually a pretty effective charger after 16KPH and it makes excellent power after 20KPH. I definitely recommend a pass-through battery for bikepacking as you will end up losing charge regularly otherwise and your device won’t like that. Please check out my in-depth battery article linked in the description.

The only downside to the 920 is that the geometry is a bit quirky – the bike would benefit from a slacker head tube angle, longer fork offset and lower bottom bracket, in particular. But they’re also not a deal-breaker.

Riverside 920 vs. 29″ Category Average
Weight:
12.7kg – Category 11.9kg (7% more than average)
Steering Speed: 76mm – Category 79mm (4% faster than average)
Low Climbing Gear: 22 gear inches – Category 24 gear inches (8% lower than average)

27.5″ Gravel – Poseidon Redwood ($899)

Amongst 27.5″ gravel bikes, the Poseidon Redwood honestly seems too good to be true.

This is a ridiculously good value bike at just $899, and it has a more generous 2.5″ tyre clearance than any bike in this category. It’s running a 1X10 Microshift groupset which is generally well-received, it has modern frame features and lots of bikepacking mounts. The 22″ climbing gear is perfect and it’s tubeless-ready too.

My only criticism is that the handlebar will be very low for riders above 180cm/5ft11 – especially if you have long legs for your height.

Poseidon Redwood vs. 27.5″ Category Average
Weight:
~12.5kg – Category 10.8kg (16% more than average)
Steering Speed: 74mm – Category 65mm (14% slower than average)
Low Climbing Gear: 22 gear inches – Category 25 gear inches (12% lower than average)

27.5″ Gravel Ultralight – Diamondback Haanjo 6C ($2500)

best bikepacking bikes

I’ve recommended the Diamondback Haanjo ever since it came out, and the 2021 version is no exception.

This full-carbon 27.5″ gravel bike tips the scales at 9.7kg. It has a mid-range SRAM Rival 1X groupset paired with some rather nice Praxis cranks. The wheels are relatively lightweight and the bike is set up tubeless from the factory.

While the tyre clearance is not on the same level as the Redwood, the 50mm wide rubber will be great for the majority of gravel rides.

Diamondback Haanjo vs. 27.5″ Category Average
Weight:
9.7kg – Category 10.8kg (10% less than average)
Steering Speed: 69mm – Category 65mm (6% slower than average)
Low Climbing Gear: 24 gear inches – Category 25 gear inches (4% lower than average)

700C Gravel – Jamis Renegade S3 ($1349)

best bikepacking bikes

In the gravel 700C gravel category, I really like the Jamis Renegade steel.

For starters, it has one of the most thought-out frame geometries. The two smallest sizes come with 650B wheels which are a better fit for a smaller rider. They help reduce the frame standover and decreases the toe overlap. The fork offset is longer in the middle frame sizes, which aids in reducing toe overlap for average riders. You’ll notice the chainstays get longer as the bikes get bigger. This is how all gravel bikes should be sized as the long chainstays help to correct the front and rear weight distribution of a tall cyclist.

The Renegade is using a Shimano GRX 2X drivetrain to give it the holy trinity – a wide gear range, small gear jumps when you change gears and a lower climbing gear than almost all gravel bikes. This will make the drivetrain equally as nice to use on-road and off-road.

The frame uses smaller diameter steel tubing to increase the side-to-side flex of the bike when compared to other gravel bikes, which gives it a lively ride underneath you. Even though the frame is made from steel, the full-carbon fork helps to save lots of weight – resulting in an 11kg bike.

Bike Snapshot vs. 700C Category Average
Weight:
11.0kg – Category 10.2kg (8% more than average)
Steering Speed: 61mm – Category 68mm (10% faster than average)
Low Climbing Gear: 23 gear inches – Category 26 gear inches (9% lower than average)

700C Gravel Ultralight – Canyon Grail 7 ($1999)

best bikepacking bikes

Have you noticed that this is the fifth green bike in a row? This colour is clearly on trend!

If you’re after something ultralight and good value, it’s hard to go past the Canyon Grail 7. This aluminium bike with a carbon fork tips the scales at just 9.4kg.

It has been specced with a 2X11 Shimano GRX groupset which offers a better than usual 24″ climbing gear and hydraulic brakes. Other notable components on the Canyon include some nice DT Swiss wheels and a carbon seatpost which has been tuned to flex 5-10mm up and down, providing a silky-smooth ride on bumpy roads.

Canyon Grail 7 vs. 700C Category Average
Weight:
9.4kg – Category 10.2kg (8% less than average)
Steering Speed: 67mm – Category 68mm (same as average)
Low Climbing Gear: 24 gear inches – Category 26 gear inches (8% lower than average)

700C Gravel Allround – Trek Checkpoint ALR5 ($2099)

best bikepacking bikes

My all-round gravel category favours bikes that can squeeze in a bit more rubber than typical, in the case of the Checkpoint, you can sometimes fit 50mm or 2.0″ wide tyres.

The Checkpoint uses the highest tier of aluminium tubing to create a frame that’s only 1.5kg. It’s using the same Shimano GRX groupset as the Canyon so the climbing gear is also appropriately low and the hydro brakes nice and powerful.

This bike has an adjustable chainstay, which means that taller riders can select the longer length while shorter riders. It’s also available in three different colours, which is unusual on higher-end bikes.

Bike Snapshot vs. 700C Category Average
Weight:
10.2kg – Category 10.2kg (same as average)
Steering Speed: 61mm – Category 68mm (10% faster than average)
Low Climbing Gear: 24 gear inches – Category 26 gear inches (8% lower than average)

The post Here Are The 13 BEST Bikepacking Bikes For 2021 appeared first on CyclingAbout.

Never Too Late: Ron’s First Bikepacking Trip At 71 (Video)

$
0
0

It’s never too late to start.

Ron Manganiello took up mountain biking in his late-60s, and has just started bikepacking in his 70s!

I’ve been cycling with Ron since October 2020 when we first met. I think some of my passion for bike travel has rubbed off because Ron has been slowly acquiring bikepacking bags and camping equipment over the last few months…

Ron is originally from Vermont (USA) but has decided to call Oaxaca (Mexico) home because this is the place on Earth where he’s happiest. Everyone here is in awe of Ron because he’s kind, funny and generous… but also because he can out-ride and out-hike people half his age.

In this film, Ron talks about how he only started mountain biking in his late-60s, why he decided to try bikepacking for the first time with me, and how he is in such great shape at 71 years old. I tried to portray how entertaining, relentlessly positive and playful Ron is in this film – I hope it comes through loud and clear!

It’s also worth mentioning that Ron started a not-for-profit in Vermont that has donated over 10,000 bikes to refugees and low-income workers. If you’re interested in finding out more about his project, check out this NPR radio interview.

Ron Manganiello with his bikepacking setup in Oaxaca, Mexico.

Like my videos? Patreon supporters get early access to my films and exclusive access to my Q&As:
PATREON (Monthly rewards!)
PAYPAL (One-off donation to replace broken camera gear!)

🔥 INSTAGRAM: HERE
🌎 FACEBOOK: HERE

MY BIKE: KOGA WorldTraveller-S 2.0
MY GEAR LIST: https://bit.ly/2C1BCKF
MY ROUTE: Coming Soon
MY CAMERAS: Panasonic G9 + 14-140mm Lens + GoPro Hero 6 + DJI Mavic Air
MUSIC: With Open Arms (Alsever Lake), El Feo (Leon Nafate), Lough Leane (Alsever Lake)

The post Never Too Late: Ron’s First Bikepacking Trip At 71 (Video) appeared first on CyclingAbout.


Why Frame Stiffness is Critical In Understanding Ride Feel & Quality

$
0
0

The stiffness of your frame plays a very large role in how your bike feels underneath you.

People often talk about bikes having a ‘dead’ feeling when they’re too stiff, a ‘noodly’ feeling when they’re too flexy and a ‘lively’ feeling when they’re just stiff enough.

After owning bikes that are stiff, flexy and everything in between, I believe there’s a Goldilocks zone for frame stiffness, where there is noticeable but minor amounts of frame flex, contributing to that buttery smooth ride that we all desire.

We are going super deep down the frame stiffness rabbit hole today. We’ll be discussing what frame stiffness is, when it’s important, the relationship between stiffness and frame materials, whether frame flex slows you down and how you might go about finding the perfect stiffness on your personal bikes.

What Is Frame Stiffness?

A bicycle frame getting stiffness tested at Zedler-Institut. Image: Matt Phillips

We can assess the stiffness of a frame from a number of different locations.

There’s the steering stiffness, which is the amount of movement the frame twists at the head tube. This type of flex is most noticeable when you push down on the pedals and pull up on the handlebar. A bike that has a high steering stiffness will feel especially snappy and more reactive to your steering inputs. Keep in mind that the overall steering stiffness is also largely dependent on the stiffness of your fork, front wheel and handlebar.

Then there’s the pedalling stiffness, which is the amount of movement your frame deflects near the bottom bracket shell when you pedal.

And finally, we can look at the vertical stiffness of a frame, which I’ve previously discussed in this article about frame comfort.

To give you a sense of the range of stiffness in a bike frame, the most rigid mass-produced frames are approximately twice as stiff as the least rigid frames.

Describing Stiffness

The Ritchey Outback has recently been praised for its flex virtues by Morgan Taylor over at The Radavist. Image: Ritchey Logic

I like to describe frame stiffness on a spectrum between two points.

A stiff or responsive bike has a snappy and direct feel to it. Under acceleration, it will have that up-and-go bike feel, but will also feel harsher over road imperfections. Additionally, there is a case to be made that the braking performance and traction is not as good when cornering a stiffer bike, so stiffness is only good to a point.

A flexy or forgiving bike is less communicative of the road or trail below and will feel laggier under acceleration. It will move around more with your rider inputs, which feels nice, again, to a point.

What Factors Affect Frame Stiffness?

My friend (and frame builder) Ewen Gellie made himself an intentionally flexy frame using thin, small diameter steel tubes.

A bike frame that feels stiff to one rider, may feel flexy to another. This is because there are multiple factors determining how much your bike will move underneath you.

First, we have rider factors. These include your power output, how much you weigh, and your riding style – for example, whether you’re riding out-of-the-saddle and accelerating quickly, or whether you’re just cruising along.

Then there’s the bike factor. The intended use of the bike will require varying degrees of stiffness too. For example, a hardcore hardtail will have higher stiffness requirements than an ultralight xc hardtail given the larger forces at play.

And lastly, there’s the luggage factor. Bikes intended to carry luggage require additional frame stiffness or the frame may become too noodly to ride.

Frame Stiffness For Touring and Bikepacking

My KOGA WorldTraveller-S uses super-stiff aluminium tubes that allow me to carry a particularly heavy load.

Touring and bikepacking bikes support front and rear luggage, and your frame is the medium that resists the twisting forces between these two points. When it comes to the handling, stability and general feel of a bike laden with luggage, touring frames need to be built extra stiff.

The downside to a bike that resists twisting forces is that it cannot be optimally tuned for riding without luggage – that is, there will not be the minimal amounts of flex that make the bike feel ‘lively’ to ride, unless it is all loaded up.

You should know that the pedalling stiffness also needs to be super stiff with belt drive touring bikes. As the beltline has a low tolerance for side-to-side flex, belt drive bikes are stiffer at the bottom bracket than any other bike, which ensures the belts cannot skip.

You can read a more comprehensive article about frame stiffness for touring bikes HERE.

Finding The Goldilocks Zone

Paul and I went bikepacking in Vietnam on aluminium Giant Contend SL bikes that offered excellent ride characteristics.

Let’s go over some rider scenarios to get a sense of when a rider can achieve noticeable but minor amounts of flex in their bike.

Heavier rider, higher power output
A higher stiffness will be required to combat both the ground forces when cornering and when pushing hard on the pedals.

Lighter rider, lower power output
On the opposite end of the weight and strength spectrum, a reduced frame stiffness will allow a lighter rider to achieve the equivalent ride feel.

Just cruising along
With a mellow riding style, a lower frame stiffness will dance around more with lighter inputs.

More aggressive riding style
If you’re out-of-the-saddle sprinting, cornering hard and just generally pushing the bike’s limits, you’ll likely prefer additional frame stiffness.

Flat handlebars or wide drop bars
Wider handlebars have more steering leverage, which makes it easier to flex your frame torsionally. To achieve the equivalent ride feel, a well-designed frame with a wide handlebar will have a higher steering stiffness.

Are Stiffer Bikes Faster?

The Cannondale System Six has a particularly high pedalling stiffness.

It is generally assumed that a bike with high pedalling stiffness is faster because there is less energy lost to the frame.

But outside of someone who is using their bike for sprint finishes, as long as your brakes don’t rub or your gears shift under load, a bike with half the stiffness at the bottom bracket is unlikely to make a meaningful difference to your cycling speed – simply because the range of deflection is so small.

The aerodynamics of a bike and rider, as well as the rolling resistance of your tyres, are orders of magnitude more important.

Some have hypothesised (and even field-tested) that most of the deflection force is returned back to the drivetrain on a flexy bike, but I find this scenario quite unlikely.

Here’s why. The frame deflection from your pedal stroke slowly builds from 1 o’clock to 3 o’clock, then slowly releases by 5 or 6 o’clock. It isn’t released in one go (with most of the variables locked in place) as some experiments have attempted to show.

In the noisy and dynamic environment of pedalling a bike on the open road, frame deflection is one of the dozens of variables that store and release energy in the system. It’s unlikely that one variable (frame flex) is responsible for the majority of the energy storage and release.

A more likely scenario is that the energy returns in part to your drivetrain, but is also lost as heat to your wheels, tyres, crankset, pedals, shoes, feet, ankles, legs etc.

Are Steel Frames Less Stiff Than Titanium, Aluminium and Carbon?

A steel gravel bike by Fairlight Cycles.

The data we will be using today comes from the legends at Tour Magazin in Germany.

They have created a standardised frame deflection test, and have over 1000 road and gravel bikes measured (of roughly the same size) for us to compare. I have kept a record of almost every bike ever tested, which will allow us to understand the deflection values of different frame materials.

The “N/mm” values are the amount of force (in newtons) required to move the head tube and bottom bracket shell a millimetre. As this is a static test, this information is not 100% definitive about how a bike will flex under a rider – although, when you look at the entire data set, the force per millimetre values correlate around the intended use of different bikes.

For example, an aero race bike used in the Tour de France usually offers a minimal amount of frame deflection, and a dedicated touring bike is often stiffer again.

Steering Stiffness // Head Tube Deflection Test – 56cm Bike (Average)
Aluminium – 105N/mm
Carbon – 97N/mm
Steel – 88N/mm
Titanium – 86N/mm

The head tube data shows that steel or titanium frames have, on average, less steering stiffness. Aluminium bikes work out to be approximately 20% stiffer than both titanium and steel, while carbon bikes are closer to 10% stiffer.

Pedalling Stiffness // Bottom Bracket Deflection Test – 56cm Bike (Average)
Aluminium – 63N/mm
Carbon – 62N/mm
Steel – 53N/mm
Titanium – 53N/mm

At the bottom bracket shell, the carbon and aluminium frames are again stiffer, with 20% more force required to move the cranks a millimetre than either titanium or steel.

These lower frame deflection values at both the bottom bracket and head tube could explain why steel and titanium bikes are often considered to have a nicer ‘ride feel’.

But this isn’t the end of the story – let’s take a look at the total range of deflection on all bikes tested.

Head Tube Deflection Test – 56cm Bike (Range)
Aluminium – 69 to 145N/mm
Carbon – 63 to 131N/mm
Steel – 69 to 115N/mm
Titanium – 75 to 106N/mm

Bottom Bracket Deflection Test – 56cm Bike (Range)
Aluminium – 45 to 87N/mm
Carbon – 39 to 84N/mm
Steel – 42 to 77N/mm
Titanium – 44 to 68N/mm

Above is the lowest and highest deflecting bike of each frame material. When we look at these ranges, it is clear that a bicycle engineer can design a very responsive (stiff) or forgiving (flexy) bike using any frame material.

Small Bike Sizes

An extra-small Marin Four Corners touring bike.

So, how does a small frame compare to a big frame? Tour Magazin has the data to help us here too.

Steering Stiffness // Head Tube Deflection Test (Average)
Aluminium (50cm) – 101N/mm
Aluminium (56cm) – 105N/mm
Carbon (50cm) – 95N/mm
Carbon (56cm) – 97N/mm

Pedalling Stiffness // Bottom Bracket Deflection Test (Average)
Aluminium (50cm) – 66N/mm
Aluminium (56cm) – 63N/mm
Carbon (50cm) – 62N/mm
Carbon (56cm) – 62N/mm

The good news is that the average small bike frame is not obnoxiously stiff, which could easily be the case as smaller frame triangles are inherently stiffer than bigger ones. The fact that the stiffness values are similar means that bike engineers are doing a somewhat good job at optimising the ride quality of their bikes.

But there is still room for improvement – smaller riders are often lighter and with less power output. This would mean that many smaller riders would achieve a similar ‘ride feel’ with more frame flex when compared to taller riders.

But here’s the issue. Bikes need to be designed around the heaviest, strongest rider. An example, Australian sprinter Caleb Ewan rides an XS sized bike, and it’s safe to say his power output would be orders of magnitude different to the average rider of his height.

The Custom Bike Advantage

The Bastion bikes are constructed with titanium 3D printed lugs and filament-wound carbon tubes.

While many people get custom bikes so that they can perfect their bike fit, a better reason to get a custom frame might be to optimise the ride feel.

As most bikes are designed around the heaviest and strongest riders, the cyclists who have the most ride feel to gain from a custom bike are likely those who are lighter and with a lower power output than typical.

Bastion Cycles deserve a shoutout here for allowing their customers to specify their preferred level of frame stiffness, both torsionally and vertically, as part of the ordering process. Bastion can offer this level of customisation because they print their own titanium 3D lugs and construct their own filament-wound carbon tubes, which is pretty damn cool.

In addition, the Bastion order form has the stiffness data of a handful of popular bikes baked into it, which gives their customers a sense of how their new frame will feel underneath them.

Aluminium and Carbon Bikes With Similar Stiffness Values To Steel/Ti

The Trek Emonda ALR5 aluminium road bike has a similar bottom bracket deflection to a steel or titanium bike.

We now know that steel and titanium bikes are, on average, less stiff than carbon and aluminium bikes.

But given there’s a large range of deflection values across all frame materials, let’s say you wanted to match the flex characteristics of the average titanium or steel bike. Or perhaps you’re a bit lighter and you’re looking for something with a bit more give.

Lower stiffness bike models:
Aluminium: Trek Emonda ALR5 (road), Giant Contend (endurance), Giant Revolt (gravel)
Carbon: Trek Emonda (road), Trek Madone (road), Felt AR (road), Trek Domane (endurance), Giant Defy (endurance), Look bikes (all)

Almost all Trek and Look road bikes seem to have more torsional flex baked in. Specialized is currently trending towards less frame stiffness with their latest model Tarmac SL7 and Aethos road bikes. Giant endurance and gravel bikes are also tested to be more forgiving.

Higher stiffness bike models:
Cannondale System Six (road), Specialized Allez Sprint (road), Specialized Venge (road), Cannondale CAAD Optimo (road), Specialized Sequoia (gravel), Merida Silex Carbon (gravel), Felt Broam (gravel), Cube bikes (all).

Aero race bikes and low-cost aluminium bikes are usually the stiffest bikes of all. The data also suggests that almost all Cube bikes are built particularly stiff. And for bikepacking and touring, the Specialized Sequoia, Merida Silex and Felt Broam will ride at their best with luggage attached.

DIY Frame Stiffness Tests

Cycling through the Mars-like landscapes of Bolivia.

An excellent way to get a sense of the frame stiffness of different bikes is to benchmark them against each other.

Here are two static tests I do before riding a new bike:
1. A front end wiggle test. This involves gripping the seat between your legs and pushing and pulling on your handlebars. You will see and feel the frame twist underneath you.
2. A bottom bracket deflection test. This involves locking both brakes and applying pressure to your forward pedal. You will see the frame deflect to the side.

As these tests are static, they will only provide a ‘snapshot’ of how stiff a bike will ride on the road, so you need to go for a test ride too.

I recommend taking notes on how stiff a bike feels in the static tests as well as out on the road. Testing multiple bikes statically and dynamically will give you a sense of what ride characteristics you prefer.

And if you’re test riding a touring or bikepacking bike, see if you can do so with luggage attached.

Other Ways To Determine Frame Stiffness

The Curve GMX+ uses large, oversized titanium tubes to maximise the frame stiffness.

If you don’t have access to test bikes, it’s much harder to know how a bike will move underneath you.

The intended use of the bike is a good clue for how a bike will ride. A road race bike will usually be stiffer than a road endurance bike. A touring bike will usually be stiffer than a bikepacking bike.

With titanium and steel, it’s easier to predict ride characteristics because the largest diameter frame tubes are almost always the stiffest. This is because when you double a tube’s diameter and wall thickness, it becomes 16 times stiffer!

Carbon and aluminium are much harder to predict as there are more variables associated with the frame design. In this case, it will pay to read some reviews from journalists that you trust, who are ideally a similar height and weight to you.

Summary

Finding the Goldilocks zone of frame stiffness requires careful consideration of your physical attributes as well as your riding style, bike setup and intended use of your bike.

Interestingly, the data suggest that bikes of any frame material can be engineered to ride in a forgiving or responsive way. However, a titanium and steel bike will have a lower frame stiffness on average, which could be enough to get a lighter cyclist on a more suitable bike. But this isn’t a given – the stiffest titanium and steel bikes are much stiffer than the average aluminium or carbon bikes.

At the end of the day, I’d recommend testing lots of bikes to get a sense of the ride characteristics that you prefer and go from there.

Read About Frame Comfort HERE and Different Frame Materials HERE

The post Why Frame Stiffness is Critical In Understanding Ride Feel & Quality appeared first on CyclingAbout.

6 New Bikepacking Bikes That You Need To Know About

$
0
0

The recent popularity of bike travel is turbocharging bikepacking bike and gear innovation.

I’ve been working on a lot of long-form, highly-researched articles of late, which has meant I’ve had less time to highlight cool new bikepacking bikes…  so today, let’s go back to the CyclingAbout roots.

Here are my handpicked bunch of recent bikepacking bike developments that you need to catch up on.

Fairlight Faran 2.0

Fairlight Faran 2.0
A Fairlight Faran 2.0 decked out with Wizard Works bags. Image: Fairlight Cycles

Fairlight has been making some killer bikes for a few years now, but it’s the Faran 2.0 that really piqued my interest.

I’m not even going to scratch the surface in terms of frame details here. Instead, you should refer to this 73-page document to see the Faran 2.0 in all its glory.

What I love about Fairlight is that they not only make their bikes in five different sizes, but they offer a ‘regular’ and ‘tall’ frame option in each size.

This essentially determines the height of your handlebars in relation to your saddle, allowing riders with strong core strength and high flexibility to set their bars lower for a ‘performance’ fit; those who want a ‘relaxed’ bike fit can set their bars higher.

These geometries can also be useful for riders who have long torsos and short legs (where a regular frame is best), or short torsos and long legs (where a tall frame is best).

Fairlight Faran 2.0
An unpainted Fairlight Faran 2.0 bikepacking bike. Image: Fairlight Cycles

Onto the details. The top tube has been ovalized to provide the equivalent lateral stiffness of a bigger/heavier tube. This is a really neat touch that’s not found on many stock bikes, especially at the £899 price point (frameset).

The Faran 2.0 has some really neat modular cable guides that screw into the frame, allowing you to use the cable guides that suit your build. For example, you can mount the cable guides for both a front and rear derailleur (2X), just the rear derailleur (1X) or you can fit small plugs in lieu of the cable guides if you have Shimano Di2 wiring.

In addition, there is internal dynamo wiring up the fork (see page 36 of the Faran document), which enters the downtube (page 41) and pops out at the rear dropout for a rear dynamo light (page 43).

Otherwise, there are all the mounting points you need for racks, cargo cages and bidon cages.

Fairlight Faran 2.0
Excellent tyre clearance on the Fairlight Faran 2.0. Image: Fairlight Cycles

You can find ample tyre clearance on the Faran 2.0 – enough to fit 27.5 x 2.4” Continental X-King tyres on Hope XC rims. Or if you’re more of a smooth gravel rider, you have ample clearance for 700 x 45mm slicks.

The steering speed is particularly quick on this bike, which is mostly a function of the long 60mm fork offset. The idea behind having a quick steering frame geometry is that once you’ve put luggage on your fork, the weight of the luggage will slow the steering back down again, resulting in a bike that steers just like a regular gravel bike (without front luggage).

Low trail is a pretty sound way of designing front-loaded bikes, but keep in mind that the steering works out to be pretty twitchy when you don’t have any front luggage attached…

Read more about the Fairlight Faran 2.0 HERE.

Tumbleweed Prospector

The latest Tumbleweed Prospector fitted up with 27.5 x 3.0″ tyres. Image: Tumbleweed Bikes

The latest Tumbleweed Prospector was unveiled about six months ago. I like this bike for a number of reasons…

Firstly, it’s built around the 14-speed Rohloff internal gear hub. If you’ve been around this website for a while, you’ll know that I think Rohloff hubs are the ultimate gear system for a touring/bikepacking bike.

Rohloff gears replicate the gear range of a normal derailleur drivetrain, so you won’t miss out on any high or low gear ratios. But the key difference is that the gears are hidden away, protected by the safe confines of a sealed aluminium hub shell, making everything extremely resilient against mud, grit, dust, snow and sand.

In addition, your gears will never skip, you’ll never need to buy a cassette again, the maintenance is minimal and there are almost no parts that are susceptible to external damage.

You can read my 16 reasons to use a Rohloff hub HERE.

The Tumbleweed Prospector uses an eccentric bottom bracket to keep the chain tensioned. Image: Tumbleweed Bikes

But Rohloff aside, the reason why I wanted to share this bike is the updated tyre clearance.

The Prospector will now squeeze in 27.5 x 3.8″ tyres, which bridges the gap between a plus-bike (~3.0″) and a fat-bike (~4.8″). The boost in tyre width simply gives you more options with where your Prospector can go, which is a good thing if you prefer the adventurous side of life.

27.5 x 3.8″ tyres are not as uncommon as you’d think. You can find them on mid-fat bikes like the Canyon Dude and Salsa Beargrease.

But what is uncommon is the fact that the Prospector is using a rather normal bottom bracket shell width (73mm), which will put your feet a normal distance apart compared to all other fat bikes (100mm wide shells are pretty standard on fat bikes).

Read more about the Tumbleweed Prospector HERE.

Salsa Timberjack

The Salsa Timberjack all loaded up with bikepacking bags. Image: Salsa Cycles

I’m a sucker for a good value, well-designed bike.

Salsa has just given the Timberjack an update, and it’s now a more capable and more fun mountain bike. Priced from just $1699, all Timberjack models get a 130mm travel suspension fork along with a size-appropriate dropper seatpost (200mm drop on XL bikes!), which will help you to confidently conquer more technical terrain.

There are four different build specifications to choose from, and each of these is available with either 27.5 x 3.0″ or 29 x 2.6″ tyres.

If you ride looser trails with lots of sand, snow or mud, you’ll undoubtedly benefit from the wider 27.5+ wheels. If your trails are smoother and more compact, or you’re heading out on long dirt roads, you’ll likely enjoy the faster-rolling, less-squirmy 29″ wheels.

The Salsa Timberjack is available as a frame only. Image: Salsa Cycles

Inside the frame, there is full-length cable routing – a feature normally reserved on much more expensive bikes.

I like that the Timberjack has 17mm of chainstay length adjustability at the rear dropouts. This means you can run the chainstays shorter if you’re carving up singletrack trails, or longer if you’re out bikepacking and want some more stability out of your rig.

There is also a non-driveside dropout available that’s specifically designed to equip a Rohloff internal gear hub.

Comparing the frame geometry of the older Salsa Timberjack with the new one. Image: Bike Insights

Diving into the geometry details, we can see the frame length has been increased at the front, which will give you more confidence when riding down steeper terrain (this is because the endo angle is larger).

Increasing the front centre of a bike shifts more of your body weight from the front tyre to the rear tyre, resulting in a bit less front end grip when you’re riding seated.

To accommodate for this change in front-to-rear weight distribution, Salsa has cleverly steepened the seat tube angle by 2-degrees to put bodyweight back on the front wheel, allowing the bike to have similar amounts of front grip as previously (perhaps even more).

You can get the Timberjack frame for $599, which could be the ticket to a rowdy custom bikepacking build. If the front suspension isn’t necessary for you, pair the Timberjack frame with a Bombtrack BPC or Trek 1120 rigid carbon fork for a lightweight frameset under $1000.

You can read more about the Salsa Timberjack HERE.

Curve Titanosaur 36er

The Curve Titanosaur is not a bike for shorter riders. Image: Curve Cycling

Yep, I added some weird 36″ bike into the mix.

This prototype titanium gravel bike is currently getting manhandled down in Australia. We have deeply corrugated roads in the remote parts of our country, which can go on for 5 or 10 days – without respite.

The idea around having gigantic wagon wheels is that the ‘angle of attack’ of each corrugation is reduced, which allows you to conserve more of your forward momentum and, therefore, go faster on bumpy roads.

These wheels will technically roll along with less effort, provided the 2.25″ tyres don’t bog too far into softer road surfaces. Curve test rider, Jesse, shows that it’s pretty easy to ride up some stairs with the big wheels, which gives us some proof of concept.

A titanium fork up the front of the Titanosaur. Image: Curve Cycling

One of the downsides to a bike with wagon wheels is the weight.

Even using titanium for the frameset, carbon rims and a top-of-the-line SRAM drivetrain – it’s still 18kg/40lb. But given that Australia is flat through the centre, the weight should make almost no difference to your average cycling speed.

A bike like this is never going to be agile on trails, is limited by tyre options and will no suit shorter riders for obvious reasons. It’s also very terrain-specific.

But given I’m 198cm/6ft6 and I love to head out into the desert, this kind of gravel bike could be right up my alley.

Mahall Expedition Series Gravel Bike

The Mahall Expedition Series gravel bike is built around a long chainstay length. Image: Renaissance.Cyclist

I recently stumbled across Mahall Bikeworks and their semi-custom expedition gravel bikes. This is a bike that has been designed around 500mm chainstays, which are about 10-15% longer than a typical bike.

There are two big advantages to having longer chainstays:
(1) The longer wheelbase provides more stability at speed, which will keep your bike more composed on rougher terrain.
(2) You can more comfortably climb steeper gradients with the longer chainstays. This is because the looping angle at the back of the bike increases, meaning your front wheel will stay planted, even on the steepest ascents.

There are disadvantages to long chainstays too, but they are significantly reduced when a bike is loaded up with luggage.

Shorter chainstays are usually preferred on both mountain and road bikes. They make a bike feel more nimble when making quick direction changes, for example, when riding on singletrack, or changing your position in a peloton. And a particularly big advantage when cycling off-road is that short chainstays make your front wheel easier to lift over obstacles.

As technical singletrack makes up on a tiny percentage of most bikepacking trips, long chainstay bikes with their ability to climb well and offer extra stability, are a great direction for the industry to go, in my opinion.

It’s great to see Mahall Bikeworks joining the long chainstay ranks, along with Rivendell and Jones. A handful of European touring bike manufacturers are running 470-490mm chainstays too.

To learn more about chainstay length, dive into my Frame Geometry Masterclass.

KHS Grit 440

The KHS Grit 440 has ultra-low gear ratios for a gravel bike. Image: KHS Bicycles

The KHS Grit 440 is a nice carbon gravel bike, but it’s the drivetrain that really caught my attention.

If you have the proclivity to ride on steep gravel roads like me, you’ll know that most gravel bikes do NOT have appropriately low gear ratios. You end up dropping your pedalling cadence significantly on anything long and steep, resulting in the rapid fatigue of your muscles.

And this issue is only exacerbated further when your bike is loaded up with a bunch of gear.

When your bike is loaded up with gear, it can result in your gear ratios being too high for the terrain. Image: Focus Bikes

So, why not just be a hero and push harder?
Big gear ratios are simply not efficient for cyclists.

The key to riding comfortably in the hills, and more importantly, enjoying yourself – is to not overexert yourself when you ride.

By using appropriately low gear ratios, you will find you can climb at the same pedalling cadence (RPM) and push the same amount of power into the pedals as when you’re riding on a flat road (mechanical advantage is your friend).

According to the data from my Bikepacking Bike Buyer’s Guide, the average climbing gear across all 700C gravel bikes is 26 gear inches. In order to make this bike a climbing machine, KHS has paired 48/32t front chainrings with an 11-42t tooth cassette. The result is a low gear of 21 gear inches, which is 20% lower than average.

The best bit is that you still get a high gear ratio when using the 48t chainring and 11t rear cog.

See more modern low gear ratio 2X drivetrains HERE.
Learn about why hills are not harder than cycling on the flat HERE.
Learn how to calculate the steepest hill you can ride up HERE.

The post 6 New Bikepacking Bikes That You Need To Know About appeared first on CyclingAbout.

Lab Test: How Quickly Can You Charge A Battery or Smartphone With A Dynamo?

$
0
0

Today I want to indulge in some data to find out how quickly we can charge different batteries and devices using a bicycle dynamo USB charger.

I will be explaining how different USB chargers and dynamo hubs will affect the charge rate. We will look at the charge rates both at constant speeds (easy to predict), as well as at varying speeds (hard to predict).

I will also be describing the complexity of predicting charge times on a smartphone (super hard to predict) using some newly available data.

This article is very graph and data-heavy, so hats off if you can digest it all the first time around. Please remember, you can always skip through to the summary at the end if you just want to extract the key points.

Terminology: Volts, Amps, Watts, mAh

The Sinewave Reactor is a slim dynamo USB charger that sits above your stem. Image: Sinewave Cycles

To understand this article well, let me briefly explain a few terms.

The voltage (in volts or ‘V’) and current (in amps, or ‘A’) make up the total electrical system power.

I won’t go into too much detail about what these are, but here’s what you should know: the output voltage (V) of a dynamo is fixed (mostly). Almost all dynamo hubs are designed to put out 6-volts in AC power, and once we convert this to the DC power necessary for charging things – we end up with around 5-volts.

It’s the current (A) that fluctuates most in a dynamo charging system. At low speeds, the current will be less than 0.1-amps, and at high speeds, it can be more than 2-amps.

If you didn’t understand that, don’t worry. The most important term to remember is watts, which is the total output power. I will be using watts to benchmark different chargers and hubs throughout this resource.

We get watts simply by multiplying the volts and the amps together. For example, a dynamo hub putting out 5-volts at 1.1-amps will provide 5.5-watts at the USB plug (5V x 1.1A = 5.5W).

The Voltaic V25 battery has an energy capacity of 6400mAh.

And lastly, I’m using milliamp hours, or mAh, when I’m referring to both battery energy capacity and charging rates. You will always find the total energy capacity (in mAh) written on the battery.

Calculating Dynamo Charging Rates

A power output graph comparing the charging rates of eight different dynamo chargers. Graph: FahrradZukunft

The simplest way to calculate how quickly a dynamo hub can charge devices is to look at a power curve graph. By picking a speed that you often find yourself cycling, you can determine the amount of power available at the USB plug, and the associated charging rate.

Example: 15kph with the Forumslader V5 Ahead Charger
When we follow the light blue Forumslader V5 graph line up to 15kph, we can see it’s producing 3-watts of power. As the voltage is fixed at 5-volts on a dynamo, we can calculate the current to 0.6A, which for an hour of riding is 600 milliamps (or 600mAh). This would mean that when charging my Petzl CORE 1250mAh headlamp battery, it would fill from empty in 2 hours and 5 minutes.

Example: 15kph with the PedalCell Rim Dynamo Charger
The PedalCell (dark blue) is producing over 5-watts (5V and 1.04A) at 15kph, which for an hour of cycling translates to 1040mAh. It would fill my Petzl CORE 1250mAh headlamp battery from empty in 1 hour and 12 minutes.

Note: the data here has been recorded in 5kph intervals. To get a more accurate power output prediction, you should round up or down to the nearest 5kph of what you ride. This is because, in reality, USB chargers offer power in ‘steps’ – you’ll soon visualise this in the section Battery Charging With Varying Speeds.

Battery Storage Losses

hub dynamo cache battery
Charging into a battery? Expect a storage loss. Image: Cinq.de

The calculations we’ve just made have assumed that all power is going directly to your device. But what if you’re charging into a battery so that you can save the power for later?

When power is stored in a battery, it experiences a storage loss of around 15-20%. This essentially means that you will need to cycle for 15-20% more time to get the same amount of energy to your device.

Using the same examples as previously: if I stored the energy in a battery first, my Petzl battery would require 2 hours and 30 minutes of cycling to fill (Forumslader V5 charger @ 15kph). And I’d need to ride for 1 hour and 26 minutes to fill my Petzl battery, using a PedalCell rim dynamo charger.

Charging Differences Between Dynamo Hubs and USB Chargers

Comparing four different dynamo hubs with the kLite USB charger. Graph: Skjegg Blogspot

The power curve we previously looked at showed the differences in power available between different USB chargers. But how do dynamo hubs differ in power output?

It turns out, quite a bit…

Example: 15KPH with the Shimano UR700 hub
When we pair the UR700 with the kLite USB charger, the power available is 3-watts (5V and 0.6A), which translates to 600mAh. It would take 2 hours and 5 minutes to charge my Petzl headlamp battery with this combination.

Example: 15KPH with the Schmidt SON28 hub
If we instead use a Schmidt hub with the kLite USB charger, we’d get 1.9-watts (5V and 0.38A), which translates to 380mAh. This means that the charge time on my 1250mAh Petzl battery would be over three hours… or a 36% time difference between hubs.

The Shimano UR700 hub has been tested to offer more power than other dynamo hubs. But it comes at a cost.

When we look at the Shimano UR700 data across four different USB chargers, we can see 20-50% more power available at any given speed. While the data is limited to only four chargers, it’s quite likely that this hub will bring a significant boost in power to any dynamo charging setup.

But there is a downside to the UR700 hub – it’s more inefficient than other hubs. The amount of drag it experiences at the wheel is often 2-3x higher than the Schmidt hub, which can really add up to slow you down.

You can read more about dynamo hub drag HERE.

USB Charger Testing With Varying Speeds

dynamo usb charger
The Cinq Plug5 Plus charger integrates nicely into the steerer tube of your bike. Image: Cinq.de

While the graphs in the previous sections have given us an idea of the power output at very specific speeds, on undulating terrain, it’s unusual to cycle at a constant speed for long periods of time.

To help simulate undulating riding conditions, Fahrrad Zukunft created a dynamic test with varied cycling speeds to see which dynamo USB chargers could generate the most power.

The test is a little over the top in speed variation, but it’s still pretty interesting to see that some USB chargers are able to adapt to changes in speed better than others.

Left: The test cycle showing time in seconds (x-axis) and speed (y-axis). Right: The resulting difference in power after the 20-minute test between the dynamo hub (green) and at the USB port (red). Graphs: Fahrrad Zukunft

The test protocol had the cycling speed in 2-second steps from 10kph up to 30kph and then back down to 10kph again. The accelerations between steps took 3-seconds. This 20-minute test essentially exposes the responsiveness of the USB chargers, which are constantly trying to optimise the charging rate.

Output power at the USB port after 20 minutes:
1. Forumslader V5 (1200mWh or 240mAh)
2. Lumi Con P5 (1000mWh or 200mAh)
3. Plug5 Plus (1000mWh or 200mAh)
4. NC-17 Appcon 3000 (900mWh or 180mAh)
5. USB Werk (600mWh or 120mAh)
6. Zjego (400mWh or 80mAh)

Unexpectedly, the USB chargers with the highest power outputs did the best in this test, although the Lumi Con P5 is a standout because it offers less output power than the other chargers in the top-four, yet still manages to extract a decent charge thanks to how well it handles changes in speed.

Battery Charging With Varying Speeds

Testing a 10400mAh battery with the PedalCell rim dynamo. Graph: PedalCell

PedalCell has recently conducted a lab test (with CyclingAbout contributions 😊) to see how their rim dynamo deals with changes in cycling speed. You can read a copy of their white paper HERE.

This data is interesting because it shows how the charger constantly optimises the amount of power available at the USB port at different speeds. This is important to understand because it shows that power is delivered to your battery/device in ‘steps’ – not in the way it is depicted in the FahrradZukunft graphs above.

For the PedalCell, at least, the data suggest that around 2mph/3kph is enough to trigger a change in charge rate.

By extracting the power and time information from this graph, we can roughly calculate how much charge the PedalCell can put into a battery pack if you were cycling on undulating terrain (50-second descent followed by a 10-second climb x 60).

If you were riding the same course as the lab test, you could expect 1583mA per hour. Those are really big numbers for a bicycle dynamo on lumpy terrain!

The Complexity of Calculating Smartphone Charging Rates

The PedalCell rim dynamo fitted up to a Salsa Journeyman. Image: PedalCell

One of the most common devices that people charge on bike trips is a smartphone, but here’s the deal: it’s hard to predict charge times on a smartphone because the charging software chooses the charging rate, and there is a lot of variation between software.

The battery percentage is one factor that affects the charge rate of a smartphone – most will allow quick charging when a battery is empty, but will reduce the charge rate as you get closer to 100%.

Another factor is whether the screen is on or off. When the screen is on, a smartphone will usually accept more power than when your phone is on standby.

The apps that you’re using on your smartphone can also affect the charging rate.

And lastly, the dynamo USB charger that you’re using should also support the appropriate USB charging protocols for your smartphone. There are dozens of protocols that have been created by governing bodies and private companies to safely draw the maximum amount of power. If your charger is not using the suitable charging protocol for your smartphone, it may not achieve its full charging rate.

The PedalCell rim dynamo offers up to 70% more power than a hub dynamo. Image: PedalCell

In some cases, smartphones do not charge well from a dynamo because the charging software thinks it is receiving power from a faulty wall charger, resulting in a significant throttling of the charge rate.

One reader has informed me that their Motorola smartphone charges at just 0.3A (1.5-watts) no matter the cycling speed, even though their B&M USB Werk charger should be putting out 0.7A (3.5-watts).

The work-around for this software limitation is to simply charge into a power bank first, before sending the power to your smartphone. Unfortunately, this reader will now have the abovementioned battery storage losses, but they will also get twice as much charge going into their smartphone!

Smartphone Charging With Varying Speeds

Testing the Apple iPhone XR smartphone with the PedalCell rim dynamo. Graph: PedalCell

Ok, onto the smartphone charging data.

PedalCell conducted a lab test with three different smartphones to see how well their charger would negotiate with the smartphone software to optimise charge speeds. They tested the charging rates of these smartphones with the screen both on and off – I’m using the screen-on data for this resource.

The batteries were all at 40-50% charge – keep in mind that a smartphone tends to charge quickly here, so you will not get the same test results at 80% charge.

To get a sense of an iPhone XR’s charging speed using the PedalCell on hilly terrain, we can extrapolate the data from the graph (30-second descent followed by a 15-second climb x 80).

I’ve calculated that the charging rate is 1666mA per hour (57% of the battery capacity) on this specific riding course.

Testing the One Plus 8 Pro smartphone with the PedalCell rim dynamo. Graph: PedalCell

The PedalCell has very little negotiation time when charging the One Plus 8 Pro, showing this smartphone to charge in a similar manner to the 10400mAh battery.

So, does that mean it will be getting more charge when compared to the iPhone XR?

When we run the numbers here, the One Plus is getting around 1578mA per hour into its battery, which is about 35% of its battery capacity. While the negotiation times are quick, the peak charge rate is a little lower than the iPhone, which means that it’s not quite picking up the same amount of charge at higher speeds.

Riding course: 50-second descent followed by a 20-second climb x 51

Testing the Google Pixel smartphone with the PedalCell rim dynamo. Graph: PedalCell

The Google Pixel (2016) had the lowest charge rate of the smartphones tested.

Interestingly, the Pixel’s software chose to fluctuate the current quite a bit compared to the other phones. PedalCell has suggested it could be because the battery was 4-5 years old, but when we look at the charging rate of the Pixel 2 XL from a wall charger, the phone’s charging rate likely fluctuated out of the box.

Despite a lower peak charging rate of around 8.5-watts, the Google Pixel was still able to charge at 1362mA per hour, which is 49% of the battery capacity.

Riding course: 38-second descent followed by a 22-second climb x 60

Summary

This topic is a bit of a minefield, so if you’ve read the whole thing – congratulations! 👏🏼

At constant speeds, it’s relatively easy to predict how quickly a dynamo USB charger will fill a regular battery. We can simply look at the FahrradZukunft power output graphs to calculate how much charge per hour is possible. The graphs also indicate that some dynamo USB chargers offer substantially more power than others at different speeds.

Dynamo hubs also seem to offer a surprisingly large difference in charging performance. We can see that the Shimano UR700 has 20-50% more power available than other hubs at any given speed, although, the Skjegg data suggest that this hub has a high amount of drag for the power it offers.

Calculating charge times gets much more complicated when you’re riding in hilly terrain, as some USB chargers are more effective at varying speeds than others. As a general rule, however, the most powerful chargers will extract the most charge from your dynamo.

hub dynamo usb charger
The NC-17 Connect Appcon GT dynamo USB charger.

And finally, charging smartphones.

I wish I could give you a charge time on smartphones, but there are just too many factors to account for.

As we’ve seen with the three smartphones in the PedalCell test, the charging software plays a large role in determining the charging rate. The battery percentage is another factor, where lower percentages usually have the highest charging rates. Whether your screen is on or off, and what app you’re using will affect the charge rate too.

Thanks to PedalCell for collecting the data on charging batteries and smartphones at different speeds so that we can better understand dynamo charging! You can check out how the PedalCell rim dynamo produces more power than a hub dynamo, and at a higher efficiency HERE.

Learn About Dynamo USB Chargers HERE, Dynamo Hubs HERE, Dynamo Wiring Systems HERE, Pass-Through Batteries HERE and Dynamo Lights HERE

The post Lab Test: How Quickly Can You Charge A Battery or Smartphone With A Dynamo? appeared first on CyclingAbout.

4 New Bikepacking Products That You Need To Know About

$
0
0

The recent popularity of bike travel is turbocharging bikepacking gear innovation.

I’ve been working on a lot of long-form, highly-researched articles of late, which has meant I’ve had less time to highlight cool new bikepacking products.

Here are a handful of new bikepacking products that you need to know about!

Velo Orange Crazy Bar V2

Velo Orange Crazy Bar
The Velo Orange Crazy Bar V2 looks to be a great option for touring and bikepacking. Image: Velo Orange

I’ve extensively used the original Velo Orange Crazy Bar, including over 20,000km of South American off-road adventures. From the very first moment I used them, I loved having bullhorns for the open road, and a wide, sweptback grip section for anything off-road.

But the Velo Orange Crazy Bar wasn’t perfect.

I found the 45-degree grip section would make my hands numb after a while, the bullhorns were too long to access, and the bar tops felt a bit weird given they didn’t have any forward or back sweep.

In the end, I helped to develop the KOGA Denham Bars, which (I think) did a perfect job at addressing these concerns – you can read about the design of the Denham Bars HERE.

Velo Orange Crazy Bar
The Velo Orange Crazy Bar V2 offers some rise, plus it has more accessible bullhorns and less back sweep at the grips. Image: Velo Orange

Velo Orange is now back with the Crazy Bar V2. Here’s how it compares to the KOGA Denham Bars:
1) You’ll get about 10% more steering leverage to manoeuvre your front luggage, thanks to the 780mm width. The higher leverage means they will work best when paired with a slower steering mountain bike frame, rather than a quicker steering drop bar frame. They also won’t be as useable in narrow, urban areas.
2) You’ll get a 40mm higher riding position thanks to the additional rise.
3) You’ll get 20mm more space between the bullhorns (420mm wide).
4) You’ll get 1-degree more back sweep at the grips (35-degrees).

It’s great to see a bunch of things I prefer about the KOGA Denham Bars baked into these new bars. The shorter bullhorn length and reduced back sweep will make the hand positions less extreme (and far more usable) compared to the original bar.

Make sure to try some Ergon GC1 grips with this handlebar – they are the best grips for a swept-back bar, in my opinion.

kLite Ultra Road LD Dynamo Light

kLite Bikepacker Ultra V2
The kLite Bikepacker Ultra V2 is regarded as the best off-road dynamo light currently available. Image: kLite

kLite is an Australian company producing dynamo lights and USB chargers on a small-scale. The advantage of an electronics business of this size is that it can constantly innovate – in fact, the kLite Bikepacker Ultra V2 is already regarded as the best off-road dynamo light that money can buy.

The Bikepacker Ultra V2 is also the brightest dynamo light available (by a large margin), putting out an estimated 1300 lumens at higher speeds.

The downside to a super-bright dynamo light is that it also has a higher drag that will rob you of some speed. The Bikepacker Ultra V2 has 7-15 watts of drag at 15kph, which means it could be consuming more than 10% of your pedal power propelling you forward.

kLite Ultra Road LD
The kLite Ultra Road LD, which has a different beam shape and a reduced brightness. Image: Travers Bikes

New for 2021 is a low-drag model with a road beam shape. The kLite Ultra Road LD has been designed for ultra racing events like the Transcontinental Race or Trans America. It has 62% less drag than the off-road light, which brings its drag figures to a similar level to other high-powered road lights (eg. Busch & Muller IQ-X).

In addition, you can reduce the drag by another ~25% (at 15kph) by using a Schmidt SON Delux hub.

Needless to say, the beam shape has been optimised for road riding, featuring a longer and narrower shape. You can even use a bar switch to access a “dim” mode, which will reduce the drag further for the times when there is enough street light available.

You can read my resource about dynamo lights HERE.

Cane Creek eeSilk Suspension Seatposts

Cane Creek eeSilk
There are not many ways to improve the comfort of your bike more than with a suspension seatpost. Image: Cane Creek

I’ve been using the Cane Creek eeSilk suspension seatpost for the last two years.

If you haven’t heard of this post before, it’s designed to both dampen vibrations and absorb bigger hits from the road thanks to its 20mm of vertical compliance.

The spring rate and damping are achieved using a small elastomer, of which there are five different spring rates to choose from. Swapping them out takes just a minute or so.

The best thing about the eeSilk is that you barely notice it smoothing out the bumps underneath you. Compared to coil-spring suspension seatposts, which are noticeably springy/active underneath you, the rebound rate of an elastomer post is slower, resulting in a more ‘muted’ ride feel.

The downsides to elastomers are that they aren’t quite as active over fast repetitive bumps and they do not work as well in sub-zero conditions (the elastomer material gets harder).

Cane Creek eeSilk
A carbon and aluminium version of the Cane Creek eeSilk is now available.

Cane Creek has just released a newer version of the eeSilk in a carbon and aluminium version. There are a few tweaks to the design, which should make it more durable.

The aluminium eeSilk is also 33% cheaper – it’s US $199. This is an absolute bargain considering how much this part could improve your ride comfort.

For $100 more you can get the carbon version which is 50-grams lighter, but I’m not sure the $2 per gram saved is a great value proposition on a bike loaded up with gear…

You can read about seatposts and ride comfort HERE.

Tailfin Aeropack Alloy

Tailfin Aeropack Alloy
The 20-litre Tailfin Aeropack Alloy fitted up to a Specialized Epic mountain bike. Image: Tailfin.cc

“Alee – nobody needs a Tailfin. You can just get a rack and put a dry bag on it!”

Here’s why I think the Tailfin Aeropack Alloy is still an awesome product:

1. The bag has a rolltop. My favourite bag on my touring bike is my rolltop Ortlieb Rack-Pack that sits above my rear panniers. It’s stocked with the items that I need regularly – usually food, rain gear or warm layers – and I can open and close it in seconds. A dry bag strapped to a rack loses this functionality, so too does a regular bikepacking seat pack.

2. It will fit bikes without any rack mounts (most carbon bikes). The mounting points for the Tailfin rack are a seatpost clamp and some axle mounts. It’s also guaranteed to be stable compared to a bikepacking seat pack (no bag wag when loosely packed).

3. The entire bag and rack are removable from your bike in seconds. This allows you to own a gravel, road or mountain bike that spends most of its time without a rack, but when you want to travel somewhere (or ride to work), you can quickly install the Tailfin Aeropack to your bike.

Tailfin Aeropack Alloy
The Tailfin Aeropack Alloy axle mount is quick and easy to use. Image: Tailfin.cc

4. There are lots of bag options. The alloy rack has pannier mounts, 3-boss cargo cage mounts and a new rear fuel bottle “AP Mount”. You can essentially dress it up or down with luggage depending on your required capacity. The Tailfin will carry up to 27kg/60lb, which is mighty impressive considering the rack is only about half a kilogram (~1lb).

5. It’s more aerodynamic than riding without it! I’m kind of joking here, but also not. Francis Cade took a Tailfin into a wind tunnel and found that he was 1 minute and 27 seconds faster over a 100km ride, likely because the airflow was separating cleaner behind his body.

Ok, the cost. The Tailfin Aeropack Alloy starts at £189/$259, but can be as expensive as £289/$399 in some configurations. It’s certainly not cheap, but the engineering, design and manufacturing are exceptional on the Tailfin products, in my experience.

You can see my list of stabilized bikepacking bags HERE.

The post 4 New Bikepacking Products That You Need To Know About appeared first on CyclingAbout.

Ask Me Anything: Carrying Enough Food For 92 Days, KOGA vs Tout Terrain, S&S Couplers, Padded Shorts

$
0
0

Hi there!

This page is only available to CyclingAbout website supporters. If you'd like to access this information as well as help to create more bike travel resources, feel free to sign-up HERE.

You can also access my Ask Me Anything resources over on Patreon by clicking HERE.

My main aim here is to take the quality of CyclingAbout.com to the next level. Your generous support will go directly into writing resources and improving the design, layout, speed and overall operation of the website.

All the best from the road,
Alee

The post Ask Me Anything: Carrying Enough Food For 92 Days, KOGA vs Tout Terrain, S&S Couplers, Padded Shorts appeared first on CyclingAbout.

Lab Test: Lowering Your Tyre Pressure Will Greatly Improve Your Bike’s Comfort

$
0
0

Krzysztof Wierzbicki is on a mission to find the degree to which the components of your bike can dampen vibrations.

Over the last few years, he has used his smartphone accelerometer to compare frame materials, seatposts, saddles, tyres, handlebars, stems and forks – you can see a list of all of his real-world tests on GravelCyclist.

Krzysztof’s testing has provided some interesting numbers, but he was keen to improve the accuracy of his data, so he built a treadmill that can control many more variables. He also invested in a professional accelerometer to take better measurements.

His new treadmill endeavour, BikeLab, plans to provide the best information about the additional comfort on offer from different bike components.

The Effect of Tyre Pressure On Bike Comfort

Krzysztof’s personal gravel bike set up on his test rig. Image: BikeLab.cc

The first BikeLab experiment was a tyre pressure test.

Krzysztof’s personal experience is that lowering your tyre pressure will improve your comfort more than almost any other component. His real-world testing on gravel roads and forest trails has found that the difference between 30 and 40psi is a whopping 23.8 to 27.7% reduction in vibrations at the handlebar.

To put this into context, Krzysztof tested a Lauf suspension fork to find it reduced vibrations by only 5% when compared to a regular carbon fork. Just a little bit too much tyre pressure in your front tyre and the vibration benefits of your fancy Lauf fork will have all but disappeared!

There is obviously a practical limit to reducing tyre pressure, and it will depend on your rider weight, whether you’re carrying luggage, your average speed and the types of surfaces you will be riding on.

A good tyre pressure won’t have your tyres squirming beneath you and steering unpredictably. It won’t have too much rolling resistance. It won’t allow your rims to strike the ground when you hit hard-edge bumps, resulting in pinch-flats, or worse – totalled rims.

Ok, let’s look at the lab test.

Test Equipment

Image: GravelCyclist.cc

Krzysztof used his personal titanium gravel bike for this experiment.

His Enigma Escape is built using the following components:
– Open U-Turn carbon fork
– Coefficient Wave carbon handlebar
– 110mm alloy stem
– Spinergy GX front wheel
– WTB Byway 700C x 44mm front tyre (actual width of 42mm)
– Tubeless setup

Test Method

The BikeLab test rig is set up with multiple bump heights to try to simulate gravel roads. Image: BikeLab.cc

As part of the BikeLab testing, Krzysztof built a treadmill with varying bump heights ranging from 5mm to 18mm.

Given the short distance between each bump, 8kph (5mph) on the treadmill works out to be the equivalent of riding outside at between 16-24kph (10-15mph) on a bumpy road. And 16kph on the treadmill is the equivalent of 30kph+ on bumpy roads.

The Arduino Nano 33 BLE Bluetooth accelerometer measures vibrations with a refresh rate of 478Hz. Image: BikeLab.cc

Vibrations were measured using an Arduino accelerometer with a high refresh rate. It was mounted on the handlebar next to the stem.

Krzysztof’s front wheel was placed on the treadmill and the bike was loaded with weight in a way that would simulate a rider of 75kg/165lb.

Krzysztof then took 3x 24-second vibration measurements at 5mph and 10mph, and across tyre pressures from 25psi up to 50psi. The vibrations values (in m/s²) are the average of all three runs.

Results

Let’s start by calculating the reduction in vibrations for each 5psi drop.

“Gravel Road” Test – Treadmill Speed of 16kph (10mph)
50psi – 4.1% fewer vibrations than 55psi
45psi – 6.1% fewer vibrations than 50psi
40psi – 6.8% fewer vibrations than 45psi
35psi – 12.2% fewer vibrations than 40psi
30psi – 8.5% fewer vibrations than 35psi
25psi – 9.9% fewer vibrations than 30psi

“Bumpy Forest Trail” Test – Treadmill speed of 8kph (5mph)
50psi – 3.5% fewer vibrations than 55psi
45psi – 4.7% fewer vibrations than 50psi
40psi – 5.9% fewer vibrations than 45psi
35psi – 8.9% fewer vibrations than 40psi
30psi – 12.9% fewer vibrations than 35psi
25psi – 4.5% fewer vibrations than 30psi

We can also use this data to see how higher speeds affects the level of vibrations at the handlebar (same pressures).

5mph vs 10mph at different tyre pressures:
25psi – 29.3% more vibrations at 10mph
30psi – 27.0% more vibrations at 10mph
35psi – 30.4% more vibrations at 10mph
40psi – 35.4% more vibrations at 10mph
45psi – 36.6% more vibrations at 10mph
50psi – 36.1% more vibrations at 10mph
55psi – 39.7% more vibrations at 10mph
Average: 33.5% more vibrations at 10mph

Analysis

The BikeLab test rig will also be measuring rear components such as seatposts and saddles. Image: BikeLab.cc

Dropping from 40 to 30psi results in more than 21% fewer vibrations at the handlebar
When we use the Silca Pro Pressure Calculator, it suggests that ~30psi is appropriate for a Category 3 Gravel road (85kg rider+bike). Assuming someone of this weight has 40psi in their tyres, a 10psi reduction would net them 21.8% fewer vibrations at lower speeds and 20.7% fewer vibrations at higher speeds. That’s big!

There’s more comfort to gain at lower pressures
When we look at the 5psi interval differences, we can see that the biggest comfort gains are found between 25-40psi in this test – in fact, I’ve calculated that around two-thirds of the vibration reduction is found in this pressure range.

Comfort is more important at higher speeds
On average, there were 33.5% more vibrations at 10mph using the same tyre pressure. If we consider the time exposed to higher vibrations, a rider on fast, flat gravel roads has more comfort to gain by optimising their tyre pressure than someone who rides on slow, mountainous gravel roads.

The Case For Fatter Gravel Tyres

The Ghost Fire Road Rage is a gravel bike that will fit 700c x 52mm tyres. Image: Ghost Bikes

Simply put, larger volume tyres allow for lower tyres pressures – and lower tyre pressures allow for more vibration attenuation.

According to the Silca Pro Pressure Calculator, a 700c x 45mm front gravel tyre can be used with close to 10psi less pressure than a 700c x 38mm. This will likely result in more than 20% fewer vibrations at the handlebar (assuming a 75kg rider + 10kg bike on a Category 3 Gravel road).

This is a significant gain in comfort and is one of the reasons why tyre clearance should be:
1) A priority for gravel bike manufacturers
2) A feature that consumers who prioritise comfort understand well

Yes, tyre rolling resistance can be higher with a wider tyre on some surfaces, but the tyre tread and rubber compound is a very large predictor of how well a tyre will roll. To illustrate this, consider that a 37mm wide Maxxis Re-Fuse Gravel tyre has a similar rolling resistance to a 100mm wide Schwalbe Jumbo Jim fat bike tyre on the same surface.

Summary

If you’re keen to optimise the comfort of your bike, first you’ll want to make sure you’re getting the most out of your tyres by finding the appropriate pressure for the terrain you ride. Many riders can likely decrease the vibrations on their bike by 10-20% just by dropping 5-10 psi.

As vibrations increase with speed, riders with higher average speeds have the most to gain from getting their pressures right. If you ride a lot of flatter gravel terrain, that might be you. The same riders will also benefit significantly from other comfort components like suspension seatposts and suspension stems.

You’ll want a tyre pressure that doesn’t feel too squirmy to ride, and that isn’t causing your tyres to bottom out on square-edge bumps. If you want to optimise the rolling resistance, the pressure will ideally be higher on smoother surfaces and lower on bumpier surfaces.

The Silca Pro Pressure Calculator is a great start for finding an appropriate pressure.

That said, I’ve found it to spit out far too low pressures if your system weight is heavy (bike+gear+body) and you’re riding on rough surfaces. In this case, some ‘real world’ experimentation of your own will be required.

The post Lab Test: Lowering Your Tyre Pressure Will Greatly Improve Your Bike’s Comfort appeared first on CyclingAbout.

Here Are The Best Suspension Seatposts For Touring & Bikepacking

$
0
0

Bicycle frames are stiff truss structures with little vertical compliance. As we’ve seen in my recent video about frame comfort, the majority of the vertical deflection at the back of the bike is actually found at the rear tyre, seatpost and saddle.

Today, we’ll be diving into the world of seatposts, and more specifically, suspension seatposts.

Given that cyclists often have 60 to 70% of their body weight on their saddle, I don’t know if there is any other component that offers as much of an improvement in ride comfort (assuming you’ve already optimised your tyre width and pressure).

The best bit is that a suspension seatpost upgrade is as little $100, and it’s very easy to install yourself.

6 Reasons To Use Suspension Seatposts

1. You can improve your comfort
A suspension seatpost both absorbs bigger hits as well as damping vibrations coming up from the road. The less strain your body experiences when you ride, the fresher you will feel at the end of the day… or, the longer you can ride!

2. You can stay seated for longer
Suspension seatposts allow you to pedal while seated on terrain that normally requires standing up. Compared to a rigid post on the same bumpy climb, I find that my legs often feel fresher simply because I’m standing up less.

3. You can reduce or alleviate lower back pain
It’s not uncommon to hear people with back injuries say that they couldn’t ride a bike without a suspension seatpost. By isolating vibrations and bigger hits from your body, you will put less strain on your lower back when you ride.

4. They make narrow tyre bikes much more capable
A suspension seatpost allows you to take bikes with narrow tyres on much rougher terrain than you normally could. Obviously, this isn’t an ideal situation, but you’d be surprised how off-road you can go on 38mm tyres!

5. Their performance is not height or weight dependent
The comfort of a regular seatpost is dependent on your body weight as well as the amount of exposed seatpost sticking out of your frame. As smaller riders often have less body weight and less exposed seatpost, they have the most gain with a suspension seatpost upgrade.

6. They are lighter, cheaper and more simple than a full-suspension bike
Rather than using a full-suspension bike (for comfort), you can fit a suspension seatpost to a hardtail and enjoy similar levels of comfort without the extra weight, price and complexity.

4 Reasons To Not Use Suspension Seatposts

The Cane Creek eeSilk is less than 100 grams heavier than a high-quality aluminium seatpost.

1. The Weight
You can expect a 100-500 gram (4-18oz) weight penalty over a conventional aluminium seatpost.

2. The Suspension Bob
When you pedal, your body movements create forces that can activate the suspension. This bob will occur to varying degrees depending on the seatpost model and setup.

3. You Have A Full Suspension Bike
If your bike has rear suspension, your saddle is already suspended so you do not need a suspension seatpost.

4. You Have A Fat Bike
If you’re riding a bike with 4 to 5-inch wide tyres, those tyres are likely deflecting 30-60mm over bumps, which means that the benefits of a suspension seatpost are significantly reduced.

Deflection and Damping

The Redshift Shockstop has an unconventional aesthetic.

There are two things suspension seatposts are looking to achieve:
1. A larger amount of vertical deflection (or taking the edge off bigger hits)
2. A higher level of damping (or vibration absorption)

Deflection is the total movement that a seatpost will move after an impact. A seatpost with more deflection will reduce the fatigue on your body as it protects you from harder jolts like unexpected potholes or dirt road corrugations. It’ll also allow you to keep pedalling through particularly bumpy terrain.

Damping is the speed at which a seatpost will move over repeated bumps. A seatpost that dampens vibrations effectively will help to insulate you from road buzz coming up through your bike.

High exposure to vibrations can actually increase the risk of various injuries, including lower back pain and spinal degeneration. This is why vibration exposure is often regulated in industries that require driving or operating heavy machinery.

A graph showing the vibration absorption of various seatposts. Image: BikeRadar

When we measure seatpost vibrations in a laboratory setting, we find that some seatposts can absorb 15x more vibrations than others. For example, the Thomson Elite seatpost was tested by Microbac Laboratories to absorb just 0.025gs of vibrations while the Ergon CF3 was absorbing 0.375gs.

But interestingly, data recently collected by the University of Exeter (England) suggests that once the seatpost is installed on a bike, it may not reduce vibration exposure.

That said, this test was conducted using rigid carbon and aluminium seatposts, so it’d be interesting to find out whether suspension seatposts are more effective using the same test protocol.

The Damping Systems of Suspension Seatposts

The Byschulz G.2 LT is a spring-damped suspension seatpost offering 50mm of suspension travel.

1. Spring Damping

The best way I can describe spring seatposts is that they’re very springy! This makes them exceptional on off-road terrain, as they’re super responsive to bumps.

But there is a cost to this high reactivity. I’ve found that when spring posts are perfectly set up for rough terrain, they bob more than I’d like on smooth surfaces.

The easiest way to reduce this movement is to adjust the spring pre-load – or the amount of force required to cause the saddle to start moving. This will stop the saddle bob, but will also reduce the seatposts ability to take the edge off small bumps.

If smooth roads are your thing, you’ll likely find spring seatposts a bit too active. This brings me to elastomers…

The Cane Creek Thudbuster uses elastomers to provide its damping.

2. Elastomer Damping

Elastomers are the quiet achievers as they are much less noticeable underneath you. This is the result of elastomers having an inherently slower rebound speed after an impact, which is particularly beneficial while riding on fast, bumpy surfaces like gravel roads.

I tend to prefer the ‘muted’ feel of an elastomer post. It feels more natural, for lack of a better word.

The downside to elastomers is that they can firm up in cold conditions, rendering them less effective – so, skip this design if you need it to work well in sub-zero conditions. I’ve also found they require lubrication around the edges of the elastomer, although this maintenance is essentially solved with a simple seatpost cover.

The PNW Coast is an air-damped dropper suspension seatpost.

3. Air Damping

Lastly, we have air damping, which is sometimes used in telescopic seatposts. The main advantage is that you can adjust the spring rate to a higher degree of accuracy.

Suspension Seatpost Designs

Linkage-driven suspension seatposts move in the same direction as the forces coming up from the rear wheel. This allows them to very effectively counteract (and even neutralise) bumps, reducing the impact forces travelling through your back and bum (see diagram below).

In addition, linkage posts ensure that the saddle-to-pedal distance is (mostly) maintained when the seatpost is compressed.

Telescopic seatposts move in a different plane to bump forces coming up from the rear wheel.

A telescopic post is usually considered inferior, as the angle that it compresses is different to the direction of force coming from the rear wheel – resulting in a less reactive suspension system. Telescopic posts also end up with a shorter saddle-to-pedal distance when you are riding over bumps.

Despite their flaws, telescopic posts are still very common as they’re often lighter, cheaper, more subtle and have a lower installation height.

Suspension Seatposts Vibration Test

Krzysztof’s gravel bike fitted with a Redshift Shockstop seatpost. Image: GravelBike.cc

Let’s move onto the data to see how these different seatpost designs compare.

Krzysztof over at GravelBikes.cc has been using his smartphone with a vibration meter app to compare the vibration absorption of different bike components on both a bumpy forest trail and fast gravel road.

Bumpy Forest Trail (Test 1)
Carbon rigid seatpost – FSA K-Force – Typical carbon seatpost (2.9 m/s²)
Carbon leaf seatpost – Ergon CF3 – 10% less vibrations (~2.6 m/s²)
Spring seatpost – Redshift ShockStop – 24% less vibrations (2.2 m/s²)

Bumpy Forest Trail (Test 2)
Carbon seatpost – FSA K-Force – Typical carbon seatpost (2.9 m/s²)
Air seatpost – PNW Coast – 6% less vibrations (2.8 m/s²)
Elastomer seatpost – Cane Creek eeSilk – 10% less vibrations (~2.6 m/s²)
Spring seatpost – Kinekt 2.1 – 17% less vibrations (~2.4 m/s²)

On the rough trail, the spring seatposts are, by a large margin, the most effective at mitigating vibrations (17-24% improvement when compared to a carbon seatpost).

Meanwhile, the elastomer Cane Creek eeSilk offers around half as much vibration improvement, however, it’s worth noting that it only has around half the suspension travel (20mm). It’d be interesting to see how a longer-travel elastomer seatpost compares here.

And finally, the air seatpost improved things a bit (6% improvement) but clearly requires a higher bump force to activate than other suspension seatposts.

Fast Gravel Road (Test 1)
Carbon seatpost – FSA K-Force – Typical carbon seatpost (3.8 m/s²)
Air seatpost – PNW Coast – Same vibration level (3.8 m/s²)
Carbon leaf seatpost – Ergon CF3 – 13% less vibrations (3.3 m/s²)
Spring seatpost – Redshift ShockStop – 21% less vibrations (3 m/s²)

Fast Gravel Road (Test 2)
Spring seatpost – Kinekt 2.1  – 10% less vibrations (3.4 m/s²)
Elastomer seatpost – Cane Creek eeSilk – 17% less vibrations (~3.15 m/s²)

The gravel road with fast, repetitive bumps narrows the difference between an elastomer seatpost and a spring seatpost despite the variation in suspension travel. This is because the bump force is lower on gravel roads, which means that the spring post is likely only using half its travel anyway.

The air seatpost showed little difference from the typical carbon seatpost in this test.

Choosing The Suspension Travel

The Cane Creek Thudbuster LT (left) has 90mm of vertical travel, while the Thudbuster ST has 50mm.

Suspension seatposts are available with anything from 20 to 90mm of travel. So, how much travel is best for you?

Rougher roads warrant more suspension travel
As we just saw in the test, if you’re riding on rougher terrain with larger forces coming from the rear wheel, you will benefit from more suspension travel as it can dampen more vibrations. I’d say most rough roads can be comfortably cycled with just 35mm of travel, but 50mm+ may be required if you’re hitting bumps at a higher speed (on an eBike, for example).

More upright riding positions are also better suited to longer suspension travel
This is simply due to the higher percentage of weight on your saddle. Conversely, if you have more weight on your hands because you ride in a more sporty position, you can get away with less suspension travel.

Best Suspension Seatposts

Coil Sprung

The Kinekt 2.1 and Kinekt 3.1 are among the most active seatposts on this list, offering 35mm of travel. There are five spring rates to choose from, suiting riders right up to 145kg/320lb. The carbon model (3.1) is the lightest coil-sprung seatpost money can buy at 471 grams.

These seatposts are particularly active or ‘bobby’ in the initial part of their travel, so they tend to be better suited to rougher trails, rather than smoother roads – in my experience.

That said, you can quickly firm things up without using any tools via the preload “control knob”, which is an optional extra for $16.

Buy the Kinekt for $249 on Amazon – 25.4, 27.2, 30.9, 31.6mm
Buy the Kinekt carbon for $329 on Amazon – 27.2mm

The Redshift Shockstop is the best coil-sprung post I’ve tested, as it seems to do a great job of absorbing off-road bumps without bobbing too much on smoother roads.

However, it still isn’t perfect.

When I got the pre-load right for off-road terrain, I found there was more bob than I’d like on the road. Unfortunately, the pre-load bolt is not particularly accessible as it’s at the bottom of the seatpost, so it’s not an adjustment that you’d want to make too regularly.

The Shockstop weighs 547 grams and can be used by riders up to 110kg.

Buy it for $229 on Amazon – 27.2mm only (shims available)


The By.schulz G.2 is a very highly-rated seatpost. There is a short-travel version with 30mm, and a long-travel version with 50mm of suspension.

You can choose from five different spring rates, which will suit riders all the way up to 150kg/330lb. There are ten different diameters too, making them suitable for almost every bike.

The downsides to this seatpost are that there is no pre-load adjuster, so you might find it springy sometimes, and it’s heavier than most (around 700 grams).

Buy it for $188 on Amazon

The low-cost suspension post of choice is the Suntour NCX.

At around $100, it’s a complete bargain, but there are downsides – it’s pretty heavy (~800 grams) and it comes with only one spring rate out of the box – although softer or firmer springs are only $15.

The maximum rider weight is 120kg.

Buy it for:
Suntour NCX 27.2mm – Buy on Amazon
Suntour NCX 30.9mm – Buy on Amazon
Suntour NCX 31.6mm – Buy on Amazon

Elastomer Sprung

I’ve spent years on the previous version of the Cane Creek Thudbuster. With its slower rebound speed, I think it’s a great option if you ride a larger percentage on smoother surfaces, as you don’t really notice the suspension bob. The 50mm of travel is ample for off-road use too.

There are four spring rates to choose from suiting riders right up to 150kg.

Buy it for:
Thudbuster 27.2mm – $179 on Amazon
Thudbuster 30.9mm – $179 on Amazon
Thudbuster 31.6mm – $179 on Amazon

If you ride a mix of gravel and tarmac roads, I don’t know if you can do any better than the Cane Creek eeSilk.

At half the weight (~300 grams) and half the travel (20mm) of most squishy posts, it performs closer to the best carbon seatposts available.

But the key difference to a carbon post is that the spring rate isn’t determined by how much exposed seatpost you have, allowing you to tune it perfectly to your body weight, using the five different elastomers available.

Buy it for $199 at Nashbar

Dropper Suspension Seatposts

Regular dropper seatposts have very little vertical flex, which is an unfortunate consequence of their telescoping design.

If you love dropper posts but also want to maximise your ride comfort, there are actually two suspension options available, and a third in the works (Redshift).

The best-performing model is the Byschulz D.2 ST. It costs a small fortune, but this coil-sprung option will stay incredibly active on bumpy roads. Like the regular Byschulz ST post, there are multiple spring rates to choose from and 30mm of travel.

The other dropper option is the PNW Coast, which has 40mm of suspension travel and is the best-value dropper, by far.

This air spring system has been tested by GravelBikes.cc to be much less active than other suspension seatposts, but it’ll still take the edge off those bigger hits, and performs well on gravel roads too.

Buy it for $179 on Amazon

Summary

The Cane Creek eeSilk carbon is under 300 grams, making it the lightest suspension seatpost in this list.

A suspension seatpost is a great comfort upgrade, as it will both absorb bigger hits, as well as dampen vibrations coming up from the road. This essentially means you’ll feel fresher at the end of a long ride.

For anything slow and off-road, you cannot beat a spring-damped seatpost. These posts are incredibly active underneath you and will allow you to stay seated on rough surfaces for MUCH longer.

If you ride a decent percentage on smoother surfaces or are sensitive to suspension bob, you will prefer elastomer seatposts as they’re less noticeable underneath you.

The Cane Creek eeSilk is what I personally use and recommend.

It’s great if you have a ‘sporty’ ride position like me, or if you mostly ride smoother roads. Given it only has 20mm of travel, you will have to compromise on the rougher roads, but I still find it offers a significant comfort improvement over a regular post. Plus it doesn’t bounce, it’s light and it’s elegant.

What is your experience with suspension seatposts?

The post Here Are The Best Suspension Seatposts For Touring & Bikepacking appeared first on CyclingAbout.


Are Chainless Shaft Drive Bicycles A Genius or Terrible Idea?

$
0
0

We need to get our pedal power from the cranks to the rear wheel somehow.

Chains are clearly the most common way to propel us forward, and if you’re a regular reader here, you’ll have seen that I think belts are perfect for long-distance bike travellers.

There are far quirkier ways to propel a bike too, including shaft drive, hydraulic drive and even string drive!

In this article, you’ll find out all of the reasons why shaft drivetrains have not succeeded in the bicycle world. Make sure to stick around until the end, because we will be using our shaft drive knowledge to assess the interesting new Driven drivetrain.

What is a Shaft Drive Bicycle?

Drive shafts are commonly used in automotive and industrial applications. But what you may not know is that they’ve been used on bicycles for over 125 years.

Instead of using a chain and sprocket set up to rotate the rear wheel, two sets of bevel gears transfer energy to the rear wheel via a drive shaft. The entire drive system is usually housed in an aluminium case that doubles as the right-hand side chainstay of your frame.

Shaft drive bicycle manufacturers – who still exist today – promise no exposed moving parts, no greasy or broken chains, and no skipping gears, which all sound pretty good to me.

So, why have these drivetrains never taken off?

Derailleur Drivetrains Are Exceptional

Cannondale Slate Review
Derailleur gear systems are great… until they’re not! This is my Cannondale Slate gravel bike before I got stuck in the mud. Image: Tim Bardsley-Smith

Derailleurs are undoubtedly the best drivetrain for the majority of cycling applications.

They are cheap to manufacture, lightweight, highly efficient, and with over a century of innovation – they work really well too. Derailleurs can also be fitted to almost all bikes, you can easily source replacement parts, and you can find someone who can adjust them in most towns.

As a shaft cannot be paired with derailleurs, this is a major reason why shaft drive bikes are not more widespread.

But if you prize the ability to go huge distances on your bike with almost no maintenance, or the ability to ride in horrific weather conditions without gear adjustment, gear skipping or the need to clear debris from your drivetrain – this is where gearbox systems shine, and shaft drive can be paired with an internal gear hub.

So, for the rest of the comparison, we will be assuming someone already wants a low maintenance gearbox bike but is deciding between using chains, belts and shafts.

Reduced Drive Efficiency

A shaft drivetrain has a lower efficiency than a chain or belt. The biggest energy losses are simply due to the change in rotation direction – once at the crankset and once again at the rear hub.

We don’t have a lot of efficiency data available here, but in 1983 Josef Keller compared an unspecified shaft drive with a singlespeed chain, and found a 7% difference in drive efficiency in the shaft. This was between 50 and 200 watts pedalling output (Radmarkt 12/1983, “Der Wirkungsgrad im Fahrradantrieb”, page 71-75).

Friction Facts have tested a singlespeed chain to be about 99% efficient at 150-watts (2-watts drag), and a belt drivetrain to be 98.6% efficient (2.45-watts drag) at 250 watts power output. Using this current data, it would mean a shaft drive is around 92% efficient (12-watts drag). That said, chains and lubricants in the early-1980s were not as good as they are today, so shafts are more likely to be less than 90% efficient.

I know these numbers don’t sound like a lot, but let’s say a 70kg rider with a 15kg shaft drive bike was riding up a hill with a 5% gradient. After 10km of riding (or approximately an hour) the shaft drive bike would be four minutes behind the chain drive bike (150 watts power output).

Then again, chains and belts lose efficiency in wet or muddy riding conditions. Friction Facts has found a chain to be 94.4% efficient in muddy and wet conditions, and 92.8% efficient in muddy and dry conditions (250-watts).

So in ridiculously muddy conditions, a shaft could technically work out to be more efficient than a chain or belt (assuming you don’t use a chaincase). Or another way to look at it, a shaft in good conditions is as efficient as a chain in super muddy ones.

Extra Weight

Bevel gear wear after 1000km of lab testing. Image: Velomobile Seminar 2012

A shaft system also requires very heavy-duty components, resulting in a weight penalty of 1-2 kilograms compared to a chain or belt drivetrain.

These heavy components are absolutely necessary as shaft drivetrains undergo very high torque when a rider starts from a standstill.

Torque is a particularly big hurdle on shaft drivetrains as they use small radius bevel gears. This results in much higher forces and distortions when compared to chain or belt drive.

Or to be more technical, the moment arm on a shaft drivetrain is approximately 4-8x shorter than a chain or belt cog, so it needs to be engineered to handle 4-8x more torque. These high forces also put a lot of stress on the bearings and bevel gears, which can wear out very quickly if not engineered to the right specifications.

Ok, but what if you don’t care about efficiency or weight?

Gear Alignment

Shaft drive bicycles are visually striking, that’s for sure. Image: Paul Brodie

Another hurdle for shaft drive systems is gear alignment.

In order to reduce wear and increase drive efficiency, there is an optimal distance for the bevel gears to mesh.

All bicycle frames flex under a load, but if a frame is not stiff enough for a shaft system, it can result in imprecise gear meshing.

A proposed solution has been to use CV joints at both ends of the shaft. This would allow the frame to flex, but would also introduce more friction, weight and complexity.

A shaft system also needs to be constructed to very tight tolerances to achieve the optimal gear meshing, and additionally, the rear bevel gears need to be easily aligned by the user when installing the rear wheel.

Gear alignment is a very solvable problem but requires the appropriate frame, manufacturing tolerances and way to achieve the optimal distance between bevel gears.

Proprietory Parts

A Bridgestone Transit folding bike with a shaft drive system.

Ok, so you now have a super stiff frame and a shaft drivetrain that’s really well-designed and manufactured.

Shaft drive systems and the frames they’re built around are proprietory. This means that if you have a problem with your shaft or can no longer get replacement parts, you cannot switch your drivetrain to a belt or chain instead – your bike will have shaft drive until the end of days.

Right – before I summarise everything, let’s talk about the prototype shaft drivetrain by Driven Technologies.

The Driven Drivetrain

The Ceramicspeed Driven is a modern take on shaft drive systems. Image: Ceramicspeed

This is a slightly different take on shaft drive, as it transfers power via a series of cartridge bearings that intermesh with two circular pinion arrays.

An awesome thing about the Driven drivetrain is that it doesn’t need to be paired with an internal gear hub, which allows it to theoretically provide a very high drive efficiency in every single gear – Driven are claiming 99% or higher. In comparison, the best internal gear hub that we’ve collected data on is 92 to 97% efficient depending on the gear selected.

While the Driven drivetrain has been taken up to 45kph on a velodrome, there are significant challenges around making this drivetrain viable in the real world.

Managing the low-RPM torque is going to be a huge challenge and will require very advanced materials to achieve the appropriate strength and longevity of the pinion arrays. Driven will also need to ensure riders do not exceed the static load rating (Cor) of the small cartridge bearings too.

Driven’s CEO recently acknowledged these two hurdles in an email to CyclingTips, stating that what we’ve seen is far from the final product and that he’s confident these engineering challenges can be solved.

Driven has just received a million dollars in external investment, so it will be interesting to see if they can finally get this drivetrain off the ground.

And one final note on Driven – creating a rear frame triangle that is stiff enough to achieve precise gear meshing is another big hurdle. This will go against the current trend of reducing frame stiffness to improve the ride ‘quality’ or ‘feel’ of your bike – you can learn more about the nuances of frame stiffness in my article HERE.

Summary

Shaft drivetrains have a great reputation in the motorbike world. But in that world, the extra weight and lower drive efficiencies can be overcome by using more powerful engines.

Bicycles on the other hand are always best when the effort you’re putting into the pedals is rewarded by propelling you along efficiently.

I hope to see more shaft drive innovations in the future because I just think they’re super cool. But they have a lot of hurdles to overcome. Other than the additional weight and reduced drive efficiency, they require super-stiff frames, components built to very tight tolerances and easy user alignment of the rear bevel gears.

Chains are still the best option for most people, as they can be paired with cheap, light and efficient derailleur gears. But if you like the idea of a gearbox like the Rohloff or Pinion, I can highly recommend pairing those with low-maintenance, long-lasting belts.

Pros of Shaft Drive
– Low maintenance
– Could be more efficient than a chain/belt in super muddy conditions

Cons of Shaft Drive
– Cannot be used with the most popular bicycle gear system (derailleurs) or crank-based gearboxes like the Pinion P1.18
– Low drive efficiency (~92% shaft vs ~99% chain)
– 1-2kg heavier than a chain or belt system
– Requires a stiff frame, components built to tight tolerances, easy user alignment of the bevel gears
– Proprietory frames and shaft components mean you cannot switch to a chain or belt
– Replacement parts are very hard to source

The post Are Chainless Shaft Drive Bicycles A Genius or Terrible Idea? appeared first on CyclingAbout.

Is Rear Suspension On Gravel Bikes Genius Or A Gimmick?

$
0
0

Soft tail bikes are nothing new, I remember lusting over several of them in the 1990s.

But do they actually improve your comfort, speed and rear-wheel traction, or are they just a gimmick?

Today, we’ll be using frame deflection and vibration data to assess the effectiveness of a handful of gravel bike rear suspension designs. I’ll be estimating the spring rate of these frames, and we’ll later compare the comfort of these frames with regular diamond ones.

But first, let’s discuss when suspension is advantageous and when it’s not.

Why You Should Use Suspension

1. To Increase Traction and Bike Control On Rough Surfaces
Suspension provides a noticeable gain in traction on rough surfaces, as even a minor amount of vertical deflection at the rear axle allows the tyre to maintain contact with the ground for longer. In addition, you get more predictable bike handling as the suspension keeps your bike more composed.

2. To Maintain Forward Momentum
Bumps rob energy from your forward momentum to instead bounce your body up and down. With a suitable tyre width and pressure for the terrain, your tyres can deform well over small road irregularities, but there is a limit to what a tyre can do. When it comes to larger step changes, suspension systems allow you to better maintain your forward momentum.

3. To Improve Comfort
Suspension insulates your body from both vibrations and harder jolts coming up from the road, resulting in more rider comfort.

4. To Use Faster Rolling Tyres
Given the improved traction and bike control, you could use narrower, lighter, faster-rolling tyres and achieve the equivalent grip of a more aggressive tyre fitted to a non-suspended frame. This results in a bike that’s suited to a broader range of surfaces.

Why You Shouldn’t Use Suspension

1. You Lose Some of Your Pedal Power on Smooth Surfaces
Although suspension can improve your comfort, traction and even speed, a suspension damper is literally designed to remove energy from the system. This can be a hindrance on smoother surfaces when it bobs up and down, but in the context of a gravel bike with just 10mm of travel, the difference in average speed is unlikely to go noticed.

2. Maintenance
A bigger downside to suspension on a gravel bike could be the maintenance. That said, the designs we will be examining today are incredibly simple compared to a full-suspension gravel bike like the Niner MCR9 (which uses multiple pivot bearings and an air shock that calls for 50-100 hour service intervals). The Niner’s suspension performance is on another level, however, thanks to all that complexity.

Tour Magazin Deflection Test

The Tour Magazin frame test jig.

Tour Magazin has created a standardised frame deflection test, and have over 1000 road and gravel bikes measured (of roughly the same size).

For the rear deflection test, the frame is secured in a jig and a weight is attached to the seatpost. The amount of vertical flex is then measured. The “N/mm” values that we’ll be using are the amount of force (in newtons) required to move the frame and seatpost a vertical millimetre.

Our Four Bikes with Rear Suspension

Bike 1: BMC URS

The BMC “Unrestricted” is a carbon gravel bike that’s using an elastomer-based system that features two pins that slide on self-lubricated bushings. The system provides 10mm of vertical compliance, and there are three elastomer spring rates to choose from.

Two BMC URS bikes were tested by Tour Magazin with BMC D-shape carbon seatposts. On a number of other 56cm BMC bikes, this same seatpost required an average of 123N to flex a millimetre.

In comparison, the 2x BMC URS bikes measured at 86 and 90N/mm. If we take the average of these spring rates (88N/mm) we can say that 28% less force is required to flex the frame module a vertical millimetre than other 56cm BMC bikes with the same seatpost.

Bike 2: Wilier Cento 10NDR

The Cento is a carbon endurance road bike with clearance for 32mm tyres. I wanted to include this bike as it has a neat linkage built into the seat stays, which helps to dampen vibrations with its fitted elastomer. There are three elastomer spring rates to choose between.

Two Wilier Cento bikes were tested with Ritchey Link Flexlogic seatposts. On other 56cm bike examples, these seatposts deflected at an average of 128N/mm.

In comparison, the Centos were measured at 80 and 90N/mm. If we take the average of these spring rates (85N/mm) we can say that 33% less force is required to flex the frame module a vertical millimetre than other 56cm bikes with the same seatpost.

Bike 3: Cannondale Topstone Carbon

Two years ago, Cannondale unveiled this carbon gravel bike with both a suspension fork and a carbon leaf-spring for the rear triangle. This rear suspension system, known as Cannondale Kingpin, is said to offer between 10 to 12mm of movement at the rear axle. This design is very lightweight (1200 gram frame) but unfortunately, there is no way to adjust the spring rate.

Two Cannondale Topstones were tested with Hollowgram SAVE 27.2mm carbon seatposts. This seatpost on other bikes of the same size measured at 110 to 113N/mm – although it’s worth noting that was with 25.4mm seatposts, this larger diameter post likely has a slightly higher spring rate.

In any case, the Topstone samples were measured at 78 and 87N/mm. If we take the average of these spring rates (82.5N/mm) we can say that 27% less force is required to flex the frame module a vertical millimetre than other 56cm bikes with a similar seatpost.

Bike 4: Basso Tera

And finally, the Basso Tera is a low-ish cost aluminium gravel bike (€2099) with a carbon leaf-sprung rear triangle similar to what we’ve just seen on the Topstone. The frame is said to offer 8mm of movement at the axle, and like the Cannondale, there is also no way to adjust the spring rate of this bike.

The Tera was measured with a Microtech aluminium seatpost. While we don’t have the values for this specific post, I have found aluminium seatposts deflect at an average of 175N/mm in 56cm bikes (the deflection range is 130 to 450N/mm).

The Tera achieved approximately 110N/mm, which is 37% less force per millimetre than other 56cm bikes with aluminium seatposts.

Are These Frames Effective At Providing Traction?

As we would have hoped, these soft tail frames have lower spring rates than diamond frames with the same seatpost.

The cool thing is that by knowing the spring rate of various seatposts, we can use the rate of springs in a series equation to approximate how much force might be required to flex these frames a vertical millimetre at the rear axle.

When I put the seatpost deflection numbers into the equation, each of these frames required about 300 newtons of force to flex one vertical millimetre.

We can contrast this to the 8,568 newtons per millimetre of 56cm steel frames that were calculated by students at the University of Brighton using a finite element method. Or the 7158 to 14,316N/mm measured in a handful of steel frames in the 1990s.

That means that these soft tail frames likely require between 24 and 48x less force to flex a vertical millimetre.

As gravity exerts a force of about 9.8 newtons per kilogram of mass, when you simply apply your body weight to one of these soft tail bikes, the rear triangles are likely dipping 2-3mm into their travel. And when you’re on the road or trail, the ground forces will be deflecting the frame even more.

With a frame spring rate this low, the suspension is no gimmick – it will undoubtedly take the sting out of those medium-sized bumps, allowing you to have more traction and carry more forward momentum.

Are Soft Tail Bikes More Comfortable?

Does a frame flex as much as a seatpost?

In the last decade, component manufacturers have put a lot of research and design into creating seatposts that maximise your ride comfort by offering high levels of vibration damping and vertical deflection.

A question you might be wondering: do the best carbon flex seatposts require less force to deflect a vertical millimetre than a soft tail frame?

Tour Magazin and Microbac Laboratories have some seatpost data for us. Across multiple bikes in the Tour Magazin testing, the Canyon S15 VCLS 2.0 seatpost required 72N/mm on average. Microbac found the same seatpost deflected at 67N/mm, although this was with 2-3cm more exposed seatpost, which we would expect would have more deflection.

Tour Magazin had similarly low numbers (70N/mm) from the new Roval Terra seatpost installed in a 56cm Specialized Diverge.

As these deflection numbers are lower than what has been measured in our soft tail bikes, you can unlock the same or more vertical deflection (comfort) just by selecting the right seatpost for your body weight.

Real-World Comfort Testing

The Cannondale Topstone Carbon on test with Krzysztof. Image: GravelBikes.cc

Krzysztof at GravelBikes has conducted outdoor vibration tests on a Cannondale Topstone on both a bumpy forest trail and a fast gravel road. He then compared the levels of vibrations on these surfaces to his titanium bike fitted with a Canyon S15 seatpost.

Unfortunately, his titanium bike was set up using a different tyre and wheelset combination, so the results are not definitive by any measure. But using his titanium bike (diamond frame), he actually found a 9% reduction in vibrations on the bumpy trail, and 4% less on the gravel road.

These are the kind of results we can expect, as the spring rate of the softest spring in a series is always the one that dominates, and the Canyon S15 VCLS 2.0 is as soft as it gets.

Summary

Rear suspension systems on gravel bikes are not a gimmick.

My estimations suggest that they flex vertically with 24 to 48x less force than a typical diamond frame, which results in more traction, more comfort, more control and more forward momentum on rough terrain.

That said, if your priority is seated ride comfort, the data suggests that fitting a carbon flex seatpost (or suspension seatpost) to your diamond frame can yield the same, or possibly even less transmission of vibrations to your body.

Other than for particularly rough terrain, I think a great application for a soft tail frame design is if you use a dropper seatpost. Dropper seatposts are very stiff vertically, so a soft tail frame will play a key role in maintaining your comfort.

The post Is Rear Suspension On Gravel Bikes Genius Or A Gimmick? appeared first on CyclingAbout.

Why We Should Stop Our Obsession With Bike and Gear Weight

$
0
0

Weight is often the central focus for any discussion around bikes, components, and camping gear.

You’ll have noticed that I don’t emphasise weight very often on CyclingAbout, and that’s because it matters so much less than you think.

Don’t get me wrong, there are some great reasons to use lightweight gear, and I’ll discuss them all later in this article. But if you’re trying to reduce weight to go significantly faster, you’re probably barking up the wrong tree.

Today, we’ll find out the time penalty of each extra kilogram that you add to your bike or equipment. We’ll then compare these time penalties to other forms of cycling resistance.

Let’s start by putting weight into context.

Putting Weight Into Context

When you ride your bike up a hill, it’s not just your bike weight that you are hauling. You are pushing your body, clothes, shoes, water, food, pump, spare tube, and any luggage you might be carrying.

Your body weight makes up the majority of this load; it’s often more than 80% of the total.

While a bike that’s 10% lighter than another feels really impressive when you lift it up (eg. 9kg instead of 10kg), it often only reduces your total weight by 1% – which is now sounding much less impressive.

Shaving grams off bikes and equipment is often a very expensive pursuit too. One kilogram can be the difference between a $200 tent and a $600 tent, a $600 steel frame and a $1600 titanium frame, or a $3129 gravel bike and a $6199 gravel bike!

Additionally, lightweight products are sometimes much less durable. I find this with zips, waterproof fabrics, aluminium cassettes (and cassette bodies), tyres, and rims, in particular.

Alright, let’s find out how weight affects cycling speed.

Bike Speed Calculators

My journey to being less obsessed with weight began when I stumbled upon a website called Bike Calculator, which after filling in all of the parameters, could predict my cycling speed using a mathematical model.

I tested it out using my power output (200w), body weight (78kg), bike weight (15kg), and gear weight (various). I then created a simple 100km ride profile.

My Simple 100km Hilly Ride Profile:
» 5km up, 5km down (10x) on a 3.59%* gradient
» 1796m/5892ft* elevation gain
*The next section will explain why these numbers are oddly specific

I got time predictions on four different luggage weights so that I could work out the time, per extra kilogram, on my course.

Bike Calculator Provided The Following Time Predictions:
5kg Luggage: 4 hours, 14 minutes, 49 seconds
6kg Luggage: 4 hours, 16 minutes, 5 seconds – 76 seconds per extra kilogram
15kg Luggage: 4 hours, 27 minutes, 50 seconds – 78 seconds per extra kilogram (+13:01)
25kg Luggage: 4 hours, 41 minutes, 27 seconds – 80 seconds per extra kilogram (+26:48)

It turned out a kilogram should add between 76 and 80 seconds over 100km. And even if I reduced my power output by 30%, or set the parameters to a smaller rider (55kg) with a lower power output (120w), a kilogram was still only worth two minutes.

Considering that my route had quite a lot of climbing, a minute or two, over 4-5 hours of riding was significantly less than I had expected, so…

… I decided to conduct my own weight experiment!

Weight Testing on a Hilly Route

I rode my bike fitted with a power meter and two large panniers on a 15.37km (9.5mi) undulating route which offered 276m (905ft) of climbing. I pedalled along at 200-watts which was a power rate that I knew I could sustain over a full day of testing.

The route was well-sheltered, significantly reducing any hindrances from the wind. It was designed to mimic a day of cycling in the hills, whereby around 1800m (5905ft) of elevation would be gained over 100km.

I conducted two test runs with three different luggage weights: 5kg (11lb), 15kg (33lb), and 25kg (55lb).

Weight Testing Results

Carrying 5kg (11lb) on a 15.37km Circuit with 276m Climbing
Run 1: 39:55
Run 2: 39:25
Average: 39:40

Carrying 15kg (33lb) on a 15.37km Circuit with 276m Climbing
Run 1: 41:26
Run 2: 41:22
Average: 41:24 (+1:44 with 10kg extra)

Carrying 25kg (55lb) on a 15.37km Circuit with 276m Climbing
Run 1: 42:40
Run 2: 42:24
Average: 42:32 (+2:52 with 20kg extra)

Real-World Weight Testing vs. Mathematical Model

rolling resistance

The numbers from my test are a little abstract, so let’s extrapolate them out to 100km to see how closely they match Bike Calculator’s prediction of 78 seconds per extra kilogram.

Extrapolated Data: 100km (62mi) with 1796m (5892ft) elevation gain
5kg Load: 4 hours, 18 minutes, 4 seconds
15kg Load: 4 hours, 29 minutes, 17 seconds – 67 seconds per extra kilogram (+11:13)
25kg Load: 4 hours, 36 minutes, 47 seconds – 56 seconds per extra kilogram (+18:43)

The added time averaged out to be a touch over a minute, suggesting that my perception of how weight affected cycling speed was, indeed, a bit off.

Bike Calculator was within just 1.5 and 4.5 minutes of my outdoor testing times, which I think is impressive considering the simple ride profile I created, only matched the distance and elevation gain. I’m sure the accuracy would improve further if I spent the time to make the gradients correct.

Weight & Flat Terrain

bicycle touring argentina
I cycled 2000km across the Pampas of Argentina on very flat roads; my heavy bike didn’t seem to slow me down much.

I later attempted an outdoor weight test on flat roads. It turned out that whether I carried 5kg or 25kg, I couldn’t find any significant difference in speed at 200-watts.

Feeling confused, I fed my parameters into Bike Calculator and it predicted that I should be just 10 seconds slower per extra kilogram over 100km.

I guess that explains why my speeds were so similar; weight really doesn’t matter on the flat.

Five Situations When Weight Actually Matters

bikepacking trends
A GT Grade decked out with bikepacking bags. Image: GT Bicycles

The data and mathematical models suggest that a kilogram probably won’t slow you down that much. But there are a few instances when focussing on lightweight bikes and equipment is completely justified, in my opinion.

1. You do actually race (be honest).
The difference between winning and losing is sometimes measured in millimetres. One kilogram less is going to help here, and the benefits of that weight saving only increase the longer and more mountainous your race.

2. To improve bike handling and feel.
Heavy bikes don’t feel as snappy or responsive when accelerating or cornering, making them feel a little less inspiring to ride. They are also significantly less agile when you overload them with all your luggage.

3. To use a bike that isn’t designed to carry heavy loads.
If you’ve seen my video describing the differences between bikepacking and touring bikes, you’ll know that touring bikes are stiffer, and are built with a slew of overbuilt components (stronger wheels!) specifically to handle high luggage weights. But here’s the deal: if you can keep your luggage to a minimum, you can reliably travel on almost any bike – not just a touring bike.

A member of the Rough Stuff Fellowship doing a spot of hike-a-bike. Image: RSF Archives

4. To make lifting your bike and luggage easier.
There are many instances where you might need to carry your bike. For example, I’m often carrying my bike on hike-a-bike sections of trail, as well as up and down stairs in apartment blocks, hotels, and train stations.

5. To make flying cheaper.
A few extra kilograms can really add up when you get to the airport. Make sure to keep your bike light enough so that you don’t get caught out with crazy fees!

The Types of Resistance More Important Than Weight

Lewis Ciddor using his aero bars on the way to winning the 2018 Tour Divide race. Image: Tom Briggs

Let’s talk about the factors that are often more important than weight when it comes to cycling speed.

Bike Calculator predicts that five extra kilograms adds 2.5% more time on my 100km hilly ride profile, and it’s just 0.4% more time on a flat profile.

(Power = 200w, body weight = 78kg, bike weight = 15kg, gear weight = 0kg)

We can compare these time percentages to the two other main forms of cycling resistance – rolling and aerodynamic resistance.

rolling resistance
Testing the rolling resistance of a Schwalbe Marathon tyre. Image: Bicycle Rolling Resistance

1. Rolling Resistance

If I fit some of the slowest-rolling touring tyres (Vittoria Randonneur) to my bike instead of the fastest-rolling ones (Schwalbe Almotion), my 100km hilly route would require 12.0% more time to complete.

In this case, rolling resistance is almost 5x more significant than adding 5kg to my bike on the hilly profile (12/2.5=4.8), and 17x more significant on the flat profile (6.7/0.4=16.8).

That said, these numbers are particularly big because I’m comparing the fastest tyres with some of the slowest. But even if we compare tyres closer to the middle of this list (Marathon Greenguard vs Marathon Mondial), the rolling resistance still works out to be more significant than the extra 5kg of weight (+3.7% time on the hilly profile).

You can see my tyre rolling resistance article HERE.

The Tailfin Aeropack keeps your luggage in line with your frontal area, allowing for faster cycling speeds than panniers.

2. Aerodynamic Resistance

Through my aerodynamic testing on a flat velodrome, I found between 6.4% to 7.9% extra ride time was required to cover 100km when using panniers instead of bikepacking bags.

This means that a change in luggage set up on a flat ride could be 16-20x more significant in terms of time than if I added 5kg of extra luggage to my bike (7.9/0.4=19.8).

You can read my list of aero savings for bikepacking HERE and see my velodrome test HERE.

Summary

The data is quite clear; bike weight is not as important as you think!

My real-world testing, along with the numbers from the mathematical models, suggests that a kilogram extra weight will likely add one or two minutes on a hilly 100km bike ride. And on a flat route, a kilogram is likely worth 10 or 20 seconds over 100km.

This is worth thinking about if you find yourself obsessing over bike and gear weight.

Perhaps, you can use this information to save $1000-2000 by choosing a steel bike rather than titanium. Or when your ultralight gear wears out, maybe you could replace it with something more durable. You could even pack a thicker, more comfortable sleeping pad to get a night of better sleep!

The post Why We Should Stop Our Obsession With Bike and Gear Weight appeared first on CyclingAbout.

Hills Are Not Harder Than The Flat, Says Science

$
0
0

Hills are NOT harder than cycling on the flat. You heard that right, and today, I’m going to explain how this can possibly be the case.

If you’re feeling a little triggered because you currently find hills difficult, this information will hopefully be a game-changer for you.

By teaching you how to make hills super easy, you might even enjoy them as much as I do. After all, mountain roads are often free from cars, less populated, and more wild – plus the world always looks better from above!

Before commenting, please actually read this page because yes, there are limits to my claim. I also acknowledge that hills often feel harder, and we’ll discuss when that’s the case.

But first, here’s a simple explanation of why hills are not harder than the flat.

A Simple Explanation

When you ride your bike on a flat road, you are putting a certain amount of effort into your pedals (power output), at a certain number of crank revolutions per minute (cadence). Let’s say it’s 150 watts at 75RPM.

Now, let’s add a small incline. To combat gravity, you change into a lower gear.

Congratulations, you’re now pedalling at the same 150-watt power output and at the same 75RPM cadence as the flat road. Your heart rate is the same. Your oxygen uptake is the same. Your perceived effort is the same.

This is possible because lower gear ratios offer a higher mechanical advantage, and by having enough mechanical advantage, hills don’t have to be any harder than flat roads.

The Limits To My Claim

Ok, my claim obviously breaks down at a certain point.

This could be when the road gradient pitches up too far, your bike’s gear ratios are too high, or when your power-to-weight ratio is too low. It could also be because the surface beneath you is too slippery, too soft, too rocky, or too rooty.

But for most riders, I’ve estimated that the right gear ratios can make an 8% grade just as easy as a flat road. And strong riders might even find this to be the case with a 15% grade.

We’ll dive into how you can calculate your bike’s climbing potential shortly, but first, here’s why hills sometimes feel harder.

Why Hills Sometimes Feel Harder

1. There’s Less Air Cooling
If you’re cycling up hills in hot conditions, you won’t get the same sweat evaporation as when you’re travelling faster on the flat. This is the factor that makes climbing in tropical regions particularly challenging.

On a side note: it’s a good idea to cover your skin in hot and dry climates to reduce the sun’s heat radiation. This is why you’ll often see me cycling in a shirt. In tropical climates, fewer clothes are cooler due to the high humidity, but make sure to wear lots of sunscreen, as sunburn significantly contributes to fatigue.

2. You Get ‘Psyched Out’
There is a big psychological element to hills; for many, the idea of an hour-long climb is completely overwhelming. But by the end of this article, when you’re equipped with the knowledge about how to ride hills, along with how to optimise your gear ratios – I promise you’ll have enough mental strength to conquer them.

3. You Cannot Coast or Soft-Pedal
With gravity taking a cut of your momentum, your speed dramatically reduces when you stop pedalling to take a quick break. The good news is that with a bit of experience, soft-pedalling and coasting aren’t a necessity provided you ride at a sustainable effort for the duration of your climb.

bicycle touring brazil

4. It’s Harder To Balance
Balancing a bike at low speeds can be difficult. But like any skill, you’ll get better at balancing over time. I’d definitely recommend a wide handlebar if you want to make balancing easier.

5. The Altitude
If you’re cycling over 2000m/6500ft, you’ll notice that it’s harder to breathe. This is because there is less oxygen available. But keep in mind that cycling at altitude is harder both on the flat and in the hills.

6. Bicycle Gear Ratios Are Often NOT Low Enough
If you’re using your easiest gear and are still finding hills to be difficult, this just means your lowest gear ratio isn’t low enough. Don’t worry, it’s not your fault; when I model the average person’s power output, weight, and the typical gear ratios found on different bikes, hills are harder due to a lack of mechanical advantage.

Mechanical Advantage

Mechanical advantage is a measure of force amplification using a tool.

A lever is the most common example: levers can exert a large force over a small distance at one end, by exerting a small force over a greater distance at the other.

Calculating the force in vs. the force out in both low and high gears. Image: Wikipedia

In the case of a bicycle, it’s the length of your crank arms, the radius of your rear wheel, and the ratio between your rear and front cogs that will determine how much of your pedal force can be outputted to drive you forward.

With the same crank movement and pedal force, a low gear ratio allows us to output more force into driving us forward.

Mechanical advantage ultimately allows us to overcome the effect of gravity on a climb, but we also use it to overcome the other main forms of cycling resistance: wind and rolling resistance.

Let’s now determine the steepest hill you can comfortably climb on your bike.

How To Calculate The Steepest Hill You Can Climb

The first thing you need to understand is cadence (pedal revolutions per minute). While I normally recommend riding at whatever cadence feels most natural to you, a good minimum cadence for climbing steep hills is around 60RPM.

This is because your speed momentarily slows at the point of the pedalling phase where you have the lowest leverage on your cranks (6, 12 o’clock). As the rate of deceleration is greater when cycling uphill, we can reduce this slowing effect when we use higher cadences.

Assuming 60RPM is a good minimum cadence for climbing, let’s now use some online tools to find out the steepest hill we can ride up on our bikes.

Using a gear calculator to determine the speed of my lowest gear at 60RPM.

We will first use a bicycle gear calculator to determine the speed in our easiest gear when pedalling at 60RPM.

In my case, my mountain bike uses a 30 tooth front chainring with a 51 tooth rear cog. My tyre size is 29 x 2.4″. When I set the cadence to 60RPM, the gear calculator shows that I will be riding at 4.96kph in my lowest gear.

Note: Before you close the gear calculator, hit ‘display’ and switch from ‘speed’ to ‘gear inches’. Take note of the lowest number because you can now compare your lowest gear with every bike in my buyer’s guides.

My bike was fitted with a Stages power meter for the weight and aerodynamic testing I’ve conducted.

The next thing we need to understand is power output.

The amount of power that we put into our pedals is measured in watts. We can find out the number of watts we produce in real-time using power meters built into our cranksets, pedals, or rear hub. You can get a sense of what say, 100 watts, feels like on an exercise bike at a gym.

If you’ve never used a power meter and don’t have access to an exercise bike, know that a moderately good male cyclist can push 3.36 watts per kilogram of body weight (w/kg) for an hour, and a moderately good female can push 2.84w/kg (source: Training Peaks).

If we reduce these numbers by 35% so that you’re riding for endurance, we arrive at 2.18w/kg and 1.85w/kg.

That means if you’re a moderately good female who weighs 60kg, you can expect to comfortably ride at 111 watts up a climb (60kg x 1.85w). And an 80kg average male should be able to ride at 174 watts (80kg x 2.18w).

If you’re anywhere between novice and a world-class cyclist, you can go to the FT column on this Training Peaks chart to get a sense of your power-to-weight. Now you can reduce it by 35% (for endurance riding) and multiply it by your weight.

My Nukeproof Mega 290 bikepacking bike.

With our cadence and power sorted, we now need to determine our total weight. This is your body, bike, gear, food and water weight.

In my case, I’m currently 76kg, my bike is 15.5kg, my gear is 5.5kg, and I normally have 2kg in food and water. That’s 99kg in total.

We can now use a mathematical model to determine the steepest hill we can comfortably ride with our lowest gear.

If you’d like to get familiar with road gradients, simply go to RideWithGPS and plot a route (my tutorial is HERE). By running your mouse over the elevation profile, you will see the gradient at a specified location on your route.

Ok, let’s now input our power estimate, and body+bike weight into Bike Calculator, which I’ve found to work with high accuracy.

Initially, the calculator will spit out your cycling speed on the flat (0% gradient). It’s now time to start adjusting the grade. The aim of the game is to increase the grade until the calculated speed matches the cycling speed we previously calculated for our lowest gear.

When both of these speeds match, you’ve found your gradient threshold. To ride comfortably up a steeper hill will require a lower gear ratio, more power or less weight to maintain a 60RPM cadence.

In my case, I can ride up a 13% grade with my current low gear ratio.

Switching to a 24-tooth front chainring in the bicycle gear calculator informs me that I can now climb at 3.97kph.

We can now go back to the bicycle gear calculator to play with our gear ratios to find out how they will help with steeper grades.

For example, if I fitted a Raceface crankset to my bike, I could use a 24 tooth front chainring. At 60RPM in my lowest gear, my speed would now be 3.97kph.

Circling back to Bicycle Calculator, I can work out that 16.5% grades are now possible at a very sustainable power output and cadence.

How To Fit Appropriately Low Gears To Your Bike

Ok, so you might have just realised your gear ratios are not low enough for the gradients you ride.

You can reduce your lowest gear ratio at the chainring (by decreasing its size) or cassette (by increasing its size).

Unfortunately, drivetrain compatibility is an absolute minefield, so it’s hard to provide simple instructions for reducing your gear ratios.

Most modern mountain bikes use 1X drivetrains which typically already have the biggest cassette cogs fitted (50 to 52 tooth). The best way to get a lower gear ratio is to reduce the size of the front chainring.

Road and gravel bikes typically use 2X drivetrains. Look out for sub-compact cranksets that offer 30-tooth inner chainrings.

I’ve also successfully hacked road and gravel bike drivetrains to use bigger cassettes. The Wolf Tooth Roadlink is cheap and creates additional space at your rear derailleur for 42 tooth cassette cogs.

Another great product is the Jtek Shiftmate, which is designed to pair a myriad of drop-bar shifters with mountain bike derailleurs, again allowing compatibility with big cassettes.

Here are some of my low gear ratio resources:
Understanding gear ratios
Understanding cadence
Drop bar shifters + MTB derailleurs
Road bike cranksets
Wolf Tooth Tanpan
JTek Shiftmate

One More Hill Climbing Tip

Before I summarise everything, let me share one more climbing tip: ease up and measure your effort.

It’s really common for cyclists to turn themselves inside-out on climbs. The thing is if you maintain a sustainable effort for the duration of a climb – just like you do on the flat – you almost certainly won’t go into the red. Your body will also be ready for any upcoming climbs, day after day.

A simple way to measure your effort is by listening to your breath while you ride. If you’re gasping for air, slip down into a lower gear, breathe a bit easier, and ride at this lower speed to the top of the hill.

Summary

Ok, I’ll admit that hills aren’t always as easy as the flat. This is especially the case in hot climates and on rough terrain.

But in most circumstances, hills can be made easy, provided you ride sustainably and use appropriately low gear ratios on your bike.

Most of you already have adequate fitness and power outputs for hill climbing – it’s likely just your gear ratios that are lacking. With the right gears, you too can enjoy the jaw-dropping, mountainous regions of the world.

I’ve calculated the low gears for you in my Touring and Bikepacking Bike Buyer’s Guides, which are updated yearly for free and feature over 200 different bikes to compare. If you’d like to support this website, grab yourself a copy, and you’ll soon have a very sound understanding of the most important aspects of bikes.

The post Hills Are Not Harder Than The Flat, Says Science appeared first on CyclingAbout.

How This Genius Made A Bicycle Gearbox Using Recycled Bike Parts

$
0
0

Bicycle gearboxes have been around for almost a century, but it’s only recently that they have truly proven themselves as a worthy alternative to derailleur gears.

Gearboxes trade a small amount of drive efficiency and weight, in order to achieve a significant reduction in maintenance and component wear, as well as a higher performance in poor riding conditions.

Additionally, you can pair gearboxes with belt drive, which eliminates chain cleaning and lubrication, and allows you to pedal over 30,000km before replacing any parts.

Zerode makes gearbox mountain bikes complete with belt drivetrains.

These days you can find gearbox bikes that will cross continents, complete your daily commute or slay mountain trails.

Right now, you’re probably thinking gearboxes are pretty cool, and I agree. But have you ever thought about building your own? Like, at home with old cassette cogs and chains and plexiglass…

Well, champx (a user on Instructables) did just this. And today, I’ll be showing you both how this homemade gearbox works, and how it was constructed.

The Bicycle Gearbox Plans

The first step was to put the idea on paper.

The inspiration for the design was based on a lawnmower gearbox, which uses a similar gear selector but differs a little when it comes to the use of spur gears rather than chain and sprocket gears.

Champx first ran the numbers to determine the gear ratios and drivetrain parts that were required to make the gearbox work. Once the sprocket sizes were found, the concept was turned into a set of plans, which were drawn to scale.

From an idea floating in his head to having a full set of plans, it took champx just two weeks.

How Does The Gearbox Work?

If you’re scratching your head and trying to understand how it works, it’s time to listen up (my explanation will make the most sense if you watch my video on this gearbox).

Looking down at the gearbox from above, we can see the crank arms as well as the bottom bracket axle. The picture above on the right side should give you a sense of orientation.

The force from the pedals travels inside the gearbox to a gear selector, which slides along the axle and allows you to engage one of three different gear ratios. The first gear provides the lowest drive ratio and the third gear the highest.

Your pedal power now travels via one of three chains to the next set of sprockets on a separate axle, which then turns a sprocket on the opposite end. All four of these cogs are welded to the axle, which means that all four chains inside this gearbox spin when you pedal.

The chain on the right-hand side then connects to one last sprocket inside the gearbox. This sprocket is attached to the external sprocket, meaning they both spin at exactly the same rate. Importantly, these two sprockets are decoupled from the axle, allowing the external sprocket to spin faster or slower than your cranks. I’ll show you a video demonstration of this shortly.

The external sprocket then goes on to drive the rear wheel.

How Was The Bicycle Gearbox Made?

Special rings were machined to fit the old cassette cogs to the axle. Image: Instructables/champx

Hopefully, you now have a good understanding of what’s going on inside this gearbox. Let’s now take a look at how it was constructed.

The first thing that champx made was the bottom bracket axle and gear selector. Special rings with internal notches were machined with a mortiser, and attach the cassette cogs to the axle. The notches inside the rings allow the gear selector arm to engage the desired gear.

The sliding gear selector was installed to the bottom bracket axle. Image: Instructables/champx

The axle was later hollowed out so that the spring-loaded gear selector would fit inside. To prevent corrosion from affecting the gear selector’s ability to slide, it was made from brass – hence the gorgeous gold colour.

With the hardest bit out of the way (machining parts), champx made a test rig to try out his concept. The secondary axle was assembled with the four necessary cassette cogs, which are all welded to the axle.

The four chains were then hooked up, and the rig was ready to test.

If you watch the red stripy tape on the right-hand side of the axle, you can see it spinning at different speeds when each gear is selected.

Ok, so the concept clearly works!

Champx now needed to make the box part of the gearbox. He chose to use stacked together sheets of plexiglass so that you could see the sprockets spinning inside!

A friend machined the bearing locations into the outer sheets, but otherwise, champx used a jig saw and hole saw to shape the plexiglass, which is no easy feat.

With the gearbox coming together nicely, the next step was to make it look pretty. Champx worked his way from coarse to fine-grit sandpaper to give it that glassy look.

The box wasn’t quite wide enough, so one more 6mm sheet of orange plexiglass was added. This turned out to be the cherry on the top, and ties in really nicely with the orange chains.

The remaining shifting components now needed to be added to the gearbox.

Inside, you can see a small red rotating “hand” (shown in the video at 5:05) that pushes the gear selector to the left and right. This connects to a rod outside the gearbox, which is lifted up and down using a spring-loaded cable.

Unfortunately, the original spring mechanism didn’t provide enough cable tension, so champx built a heavy-duty version that works well.

The Completed Gearbox Bike

The finished gearbox installed in a custom-made frame! Image: Instructables/champx

With the gearbox now complete, it was time to build a bicycle frame to house it.

Given the novelty of this project, it made sense to build the gearbox into a fun bike!

The swing bike in all its glory. Image: Instructables/champx

Champx welded up a frame that he calls the “Swing Monster”. This cruiser-style bike uses headset bearings at both the fork and seatpost, so that it can steer from the front or rear wheel.

I say, mission accomplished on this project! The bike looks amazing and would be a fun challenge to ride too.

Summary

The “Swing Monster” gearbox bike out on a test ride. Image: Instructables/champx

As a bike nerd, tinkerer, gearbox aficionado and lover of cool projects – I had to share this work!

I hope it inspires some of you to build something that’s normally out of your comfort zone.

If you know of some more out-of-the-box DIY bicycle projects, I’d love to hear about them in the comments.

And if you’d like to learn more about the two most popular bicycle gearboxes, check out my article comparing the 14-speed Rohloff hub with the 18-speed Pinion gearbox.

The post How This Genius Made A Bicycle Gearbox Using Recycled Bike Parts appeared first on CyclingAbout.

Viewing all 446 articles
Browse latest View live